Cape Verdean vs Immigrants from Eritrea Median Earnings
COMPARE
Cape Verdean
Immigrants from Eritrea
Median Earnings
Median Earnings Comparison
Cape Verdeans
Immigrants from Eritrea
$44,640
MEDIAN EARNINGS
7.5/ 100
METRIC RATING
234th/ 347
METRIC RANK
$47,657
MEDIAN EARNINGS
84.8/ 100
METRIC RATING
148th/ 347
METRIC RANK
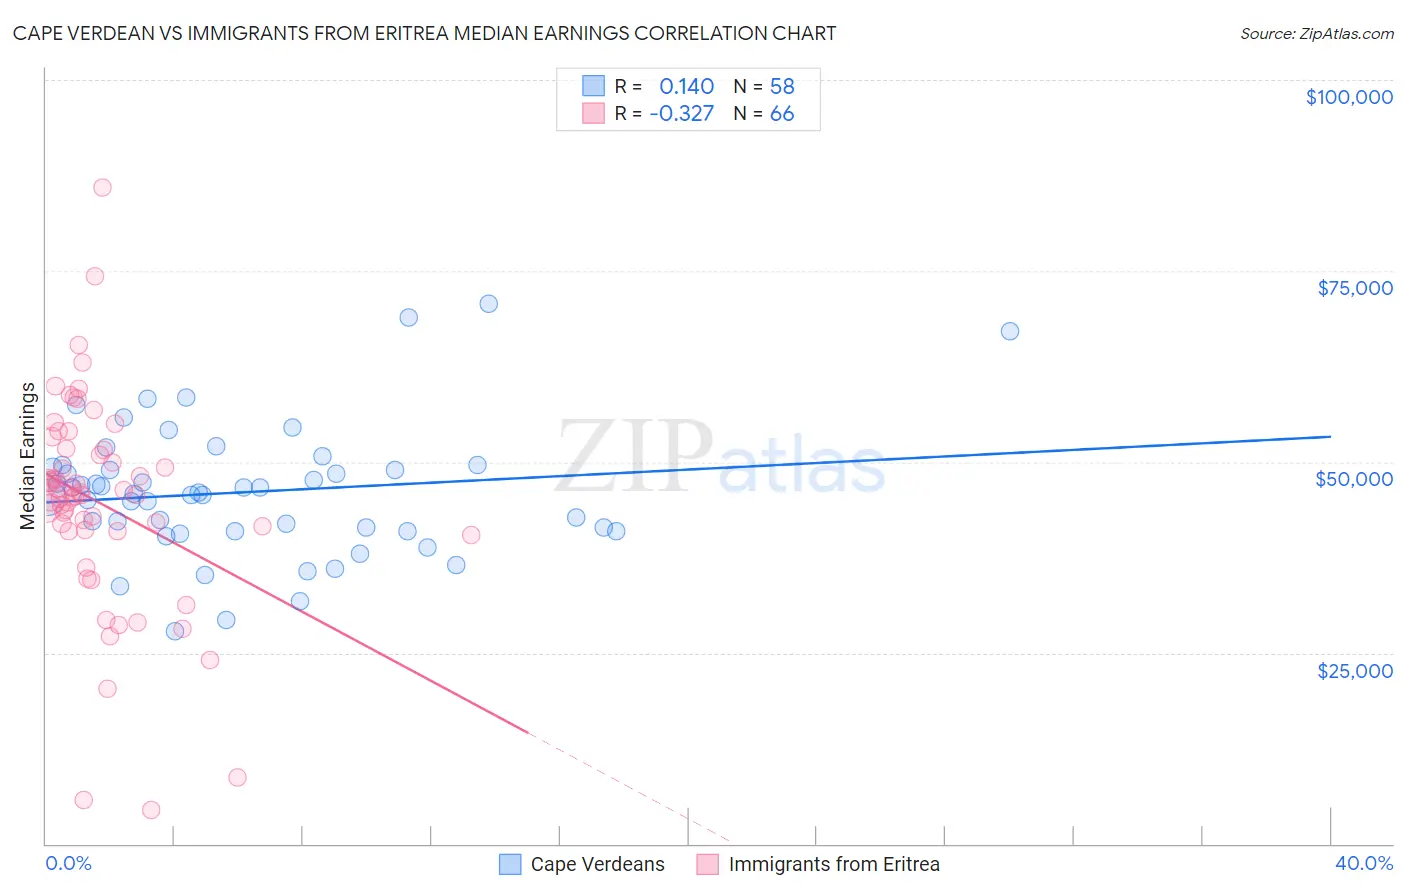
Cape Verdean vs Immigrants from Eritrea Median Earnings Correlation Chart
The statistical analysis conducted on geographies consisting of 107,579,856 people shows a poor positive correlation between the proportion of Cape Verdeans and median earnings in the United States with a correlation coefficient (R) of 0.140 and weighted average of $44,640. Similarly, the statistical analysis conducted on geographies consisting of 104,854,314 people shows a mild negative correlation between the proportion of Immigrants from Eritrea and median earnings in the United States with a correlation coefficient (R) of -0.327 and weighted average of $47,657, a difference of 6.8%.
Median Earnings Correlation Summary
| Measurement | Cape Verdean | Immigrants from Eritrea |
| Minimum | $27,841 | $4,426 |
| Maximum | $70,758 | $85,924 |
| Range | $42,917 | $81,498 |
| Mean | $46,038 | $44,557 |
| Median | $45,876 | $45,626 |
| Interquartile 25% (IQ1) | $40,962 | $40,964 |
| Interquartile 75% (IQ3) | $49,336 | $51,547 |
| Interquartile Range (IQR) | $8,374 | $10,583 |
| Standard Deviation (Sample) | $8,551 | $13,912 |
| Standard Deviation (Population) | $8,477 | $13,806 |
Similar Demographics by Median Earnings
Demographics Similar to Cape Verdeans by Median Earnings
In terms of median earnings, the demographic groups most similar to Cape Verdeans are Venezuelan ($44,580, a difference of 0.14%), British West Indian ($44,552, a difference of 0.20%), Immigrants from Sudan ($44,767, a difference of 0.28%), Delaware ($44,783, a difference of 0.32%), and Immigrants from Ecuador ($44,462, a difference of 0.40%).
| Demographics | Rating | Rank | Median Earnings |
| Native Hawaiians | 12.2 /100 | #227 | Poor $45,027 |
| Immigrants | Iraq | 11.6 /100 | #228 | Poor $44,988 |
| Scotch-Irish | 10.7 /100 | #229 | Poor $44,924 |
| Immigrants | Western Africa | 10.3 /100 | #230 | Poor $44,893 |
| Japanese | 9.5 /100 | #231 | Tragic $44,825 |
| Delaware | 9.0 /100 | #232 | Tragic $44,783 |
| Immigrants | Sudan | 8.8 /100 | #233 | Tragic $44,767 |
| Cape Verdeans | 7.5 /100 | #234 | Tragic $44,640 |
| Venezuelans | 6.9 /100 | #235 | Tragic $44,580 |
| British West Indians | 6.7 /100 | #236 | Tragic $44,552 |
| Immigrants | Ecuador | 5.9 /100 | #237 | Tragic $44,462 |
| Sudanese | 5.6 /100 | #238 | Tragic $44,419 |
| Senegalese | 5.3 /100 | #239 | Tragic $44,373 |
| Aleuts | 4.4 /100 | #240 | Tragic $44,241 |
| Samoans | 4.2 /100 | #241 | Tragic $44,206 |
Demographics Similar to Immigrants from Eritrea by Median Earnings
In terms of median earnings, the demographic groups most similar to Immigrants from Eritrea are Immigrants from South Eastern Asia ($47,671, a difference of 0.030%), Luxembourger ($47,640, a difference of 0.040%), Peruvian ($47,628, a difference of 0.060%), Immigrants from Chile ($47,697, a difference of 0.080%), and Immigrants from Oceania ($47,617, a difference of 0.080%).
| Demographics | Rating | Rank | Median Earnings |
| Immigrants | Sierra Leone | 88.3 /100 | #141 | Excellent $47,875 |
| Ugandans | 88.0 /100 | #142 | Excellent $47,854 |
| Swedes | 88.0 /100 | #143 | Excellent $47,851 |
| Hungarians | 87.1 /100 | #144 | Excellent $47,795 |
| Immigrants | Saudi Arabia | 85.6 /100 | #145 | Excellent $47,704 |
| Immigrants | Chile | 85.5 /100 | #146 | Excellent $47,697 |
| Immigrants | South Eastern Asia | 85.0 /100 | #147 | Excellent $47,671 |
| Immigrants | Eritrea | 84.8 /100 | #148 | Excellent $47,657 |
| Luxembourgers | 84.5 /100 | #149 | Excellent $47,640 |
| Peruvians | 84.2 /100 | #150 | Excellent $47,628 |
| Immigrants | Oceania | 84.1 /100 | #151 | Excellent $47,617 |
| Immigrants | Germany | 83.1 /100 | #152 | Excellent $47,566 |
| Slavs | 81.1 /100 | #153 | Excellent $47,470 |
| Immigrants | Portugal | 77.3 /100 | #154 | Good $47,304 |
| Immigrants | Vietnam | 76.7 /100 | #155 | Good $47,282 |