Immigrants from Zaire vs Immigrants from Kuwait Median Earnings
COMPARE
Immigrants from Zaire
Immigrants from Kuwait
Median Earnings
Median Earnings Comparison
Immigrants from Zaire
Immigrants from Kuwait
$41,325
MEDIAN EARNINGS
0.1/ 100
METRIC RATING
293rd/ 347
METRIC RANK
$48,861
MEDIAN EARNINGS
96.8/ 100
METRIC RATING
113th/ 347
METRIC RANK
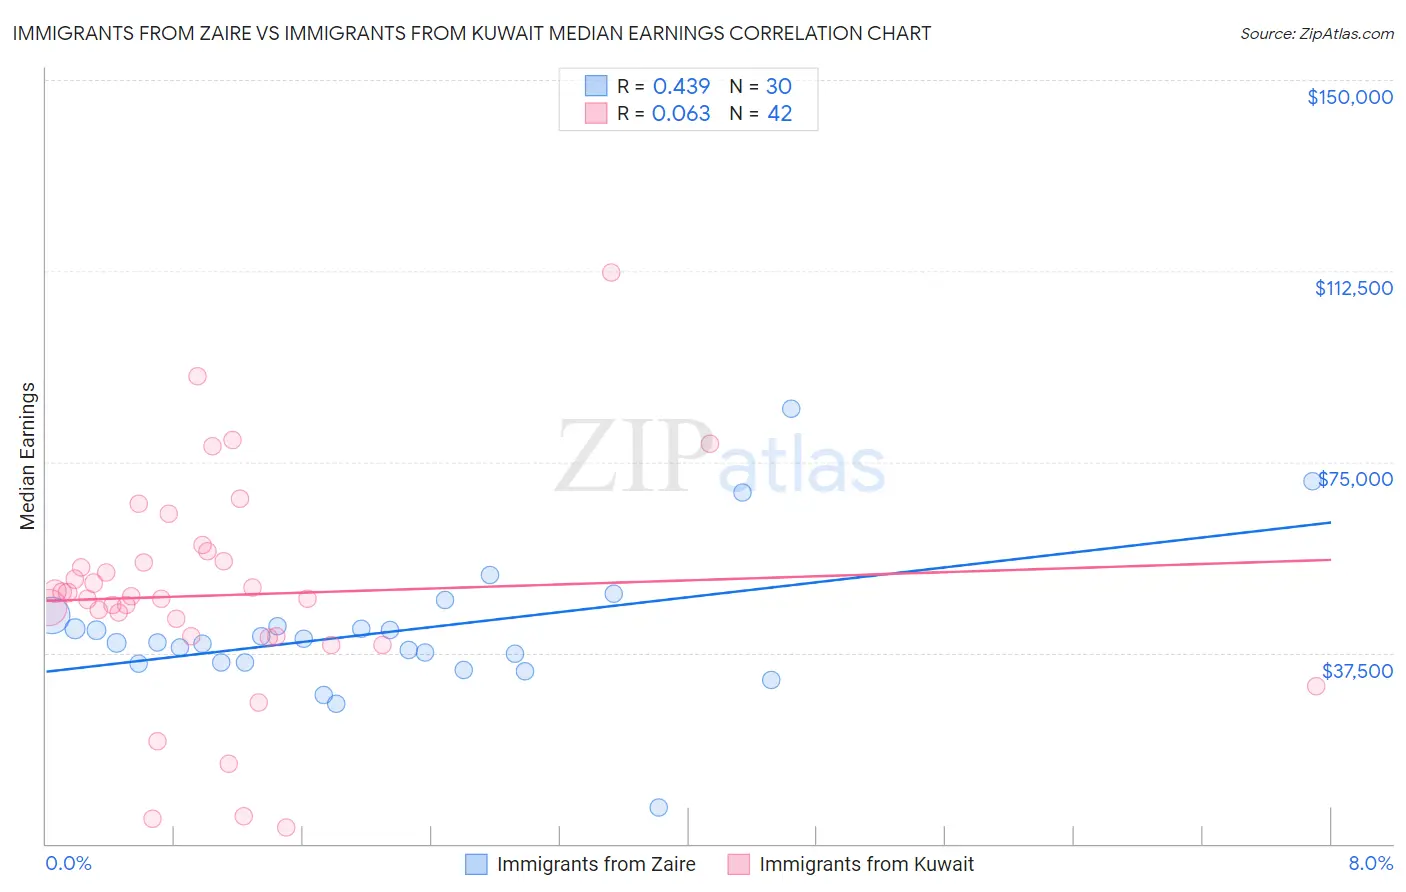
Immigrants from Zaire vs Immigrants from Kuwait Median Earnings Correlation Chart
The statistical analysis conducted on geographies consisting of 107,255,584 people shows a moderate positive correlation between the proportion of Immigrants from Zaire and median earnings in the United States with a correlation coefficient (R) of 0.439 and weighted average of $41,325. Similarly, the statistical analysis conducted on geographies consisting of 136,904,336 people shows a slight positive correlation between the proportion of Immigrants from Kuwait and median earnings in the United States with a correlation coefficient (R) of 0.063 and weighted average of $48,861, a difference of 18.2%.
Median Earnings Correlation Summary
| Measurement | Immigrants from Zaire | Immigrants from Kuwait |
| Minimum | $7,065 | $3,079 |
| Maximum | $85,536 | $112,212 |
| Range | $78,471 | $109,133 |
| Mean | $41,788 | $48,846 |
| Median | $39,475 | $48,319 |
| Interquartile 25% (IQ1) | $35,616 | $40,771 |
| Interquartile 75% (IQ3) | $42,826 | $55,536 |
| Interquartile Range (IQR) | $7,210 | $14,765 |
| Standard Deviation (Sample) | $14,049 | $21,440 |
| Standard Deviation (Population) | $13,813 | $21,183 |
Similar Demographics by Median Earnings
Demographics Similar to Immigrants from Zaire by Median Earnings
In terms of median earnings, the demographic groups most similar to Immigrants from Zaire are Potawatomi ($41,288, a difference of 0.090%), Bangladeshi ($41,263, a difference of 0.15%), Cherokee ($41,252, a difference of 0.18%), Guatemalan ($41,205, a difference of 0.29%), and U.S. Virgin Islander ($41,448, a difference of 0.30%).
| Demographics | Rating | Rank | Median Earnings |
| Mexican American Indians | 0.1 /100 | #286 | Tragic $41,719 |
| Indonesians | 0.1 /100 | #287 | Tragic $41,701 |
| Immigrants | Dominican Republic | 0.1 /100 | #288 | Tragic $41,554 |
| Comanche | 0.1 /100 | #289 | Tragic $41,519 |
| Paiute | 0.1 /100 | #290 | Tragic $41,508 |
| Central American Indians | 0.1 /100 | #291 | Tragic $41,474 |
| U.S. Virgin Islanders | 0.1 /100 | #292 | Tragic $41,448 |
| Immigrants | Zaire | 0.1 /100 | #293 | Tragic $41,325 |
| Potawatomi | 0.1 /100 | #294 | Tragic $41,288 |
| Bangladeshis | 0.1 /100 | #295 | Tragic $41,263 |
| Cherokee | 0.1 /100 | #296 | Tragic $41,252 |
| Guatemalans | 0.1 /100 | #297 | Tragic $41,205 |
| Immigrants | Micronesia | 0.1 /100 | #298 | Tragic $41,133 |
| Immigrants | Caribbean | 0.1 /100 | #299 | Tragic $41,119 |
| Ute | 0.1 /100 | #300 | Tragic $41,051 |
Demographics Similar to Immigrants from Kuwait by Median Earnings
In terms of median earnings, the demographic groups most similar to Immigrants from Kuwait are Northern European ($48,887, a difference of 0.050%), Moroccan ($48,838, a difference of 0.050%), Chinese ($48,836, a difference of 0.050%), Immigrants from Zimbabwe ($48,913, a difference of 0.11%), and Immigrants from Ethiopia ($48,924, a difference of 0.13%).
| Demographics | Rating | Rank | Median Earnings |
| Immigrants | Albania | 98.4 /100 | #106 | Exceptional $49,377 |
| Immigrants | Morocco | 98.4 /100 | #107 | Exceptional $49,368 |
| Palestinians | 98.0 /100 | #108 | Exceptional $49,209 |
| Syrians | 97.1 /100 | #109 | Exceptional $48,934 |
| Immigrants | Ethiopia | 97.1 /100 | #110 | Exceptional $48,924 |
| Immigrants | Zimbabwe | 97.0 /100 | #111 | Exceptional $48,913 |
| Northern Europeans | 96.9 /100 | #112 | Exceptional $48,887 |
| Immigrants | Kuwait | 96.8 /100 | #113 | Exceptional $48,861 |
| Moroccans | 96.7 /100 | #114 | Exceptional $48,838 |
| Chinese | 96.7 /100 | #115 | Exceptional $48,836 |
| Koreans | 96.2 /100 | #116 | Exceptional $48,727 |
| Serbians | 95.9 /100 | #117 | Exceptional $48,677 |
| Immigrants | Jordan | 95.9 /100 | #118 | Exceptional $48,673 |
| Poles | 95.8 /100 | #119 | Exceptional $48,659 |
| Carpatho Rusyns | 95.5 /100 | #120 | Exceptional $48,617 |