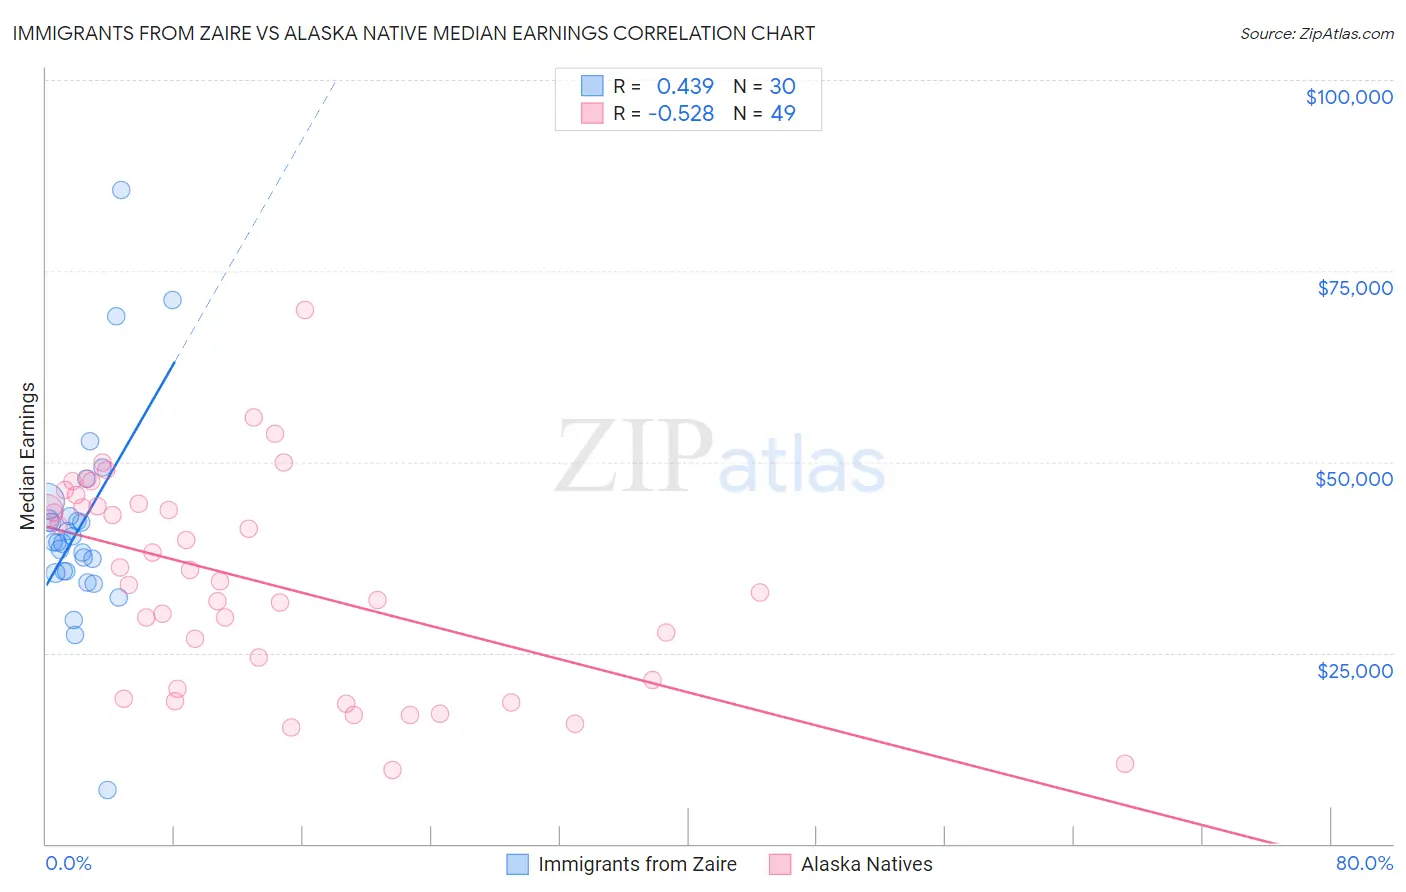
Immigrants from Zaire vs Alaska Native Median Earnings
COMPARE
Immigrants from Zaire
Alaska Native
Median Earnings
Median Earnings Comparison
Immigrants from Zaire
Alaska Natives
$41,325
MEDIAN EARNINGS
0.1/ 100
METRIC RATING
293rd/ 347
METRIC RANK
$43,750
MEDIAN EARNINGS
2.3/ 100
METRIC RATING
250th/ 347
METRIC RANK
Immigrants from Zaire vs Alaska Native Median Earnings Correlation Chart
The statistical analysis conducted on geographies consisting of 107,255,584 people shows a moderate positive correlation between the proportion of Immigrants from Zaire and median earnings in the United States with a correlation coefficient (R) of 0.439 and weighted average of $41,325. Similarly, the statistical analysis conducted on geographies consisting of 76,766,332 people shows a substantial negative correlation between the proportion of Alaska Natives and median earnings in the United States with a correlation coefficient (R) of -0.528 and weighted average of $43,750, a difference of 5.9%.
Median Earnings Correlation Summary
| Measurement | Immigrants from Zaire | Alaska Native |
| Minimum | $7,065 | $9,662 |
| Maximum | $85,536 | $69,808 |
| Range | $78,471 | $60,146 |
| Mean | $41,788 | $34,396 |
| Median | $39,475 | $34,412 |
| Interquartile 25% (IQ1) | $35,616 | $20,906 |
| Interquartile 75% (IQ3) | $42,826 | $44,339 |
| Interquartile Range (IQR) | $7,210 | $23,432 |
| Standard Deviation (Sample) | $14,049 | $13,540 |
| Standard Deviation (Population) | $13,813 | $13,401 |
Similar Demographics by Median Earnings
Demographics Similar to Immigrants from Zaire by Median Earnings
In terms of median earnings, the demographic groups most similar to Immigrants from Zaire are Potawatomi ($41,288, a difference of 0.090%), Bangladeshi ($41,263, a difference of 0.15%), Cherokee ($41,252, a difference of 0.18%), Guatemalan ($41,205, a difference of 0.29%), and U.S. Virgin Islander ($41,448, a difference of 0.30%).
| Demographics | Rating | Rank | Median Earnings |
| Mexican American Indians | 0.1 /100 | #286 | Tragic $41,719 |
| Indonesians | 0.1 /100 | #287 | Tragic $41,701 |
| Immigrants | Dominican Republic | 0.1 /100 | #288 | Tragic $41,554 |
| Comanche | 0.1 /100 | #289 | Tragic $41,519 |
| Paiute | 0.1 /100 | #290 | Tragic $41,508 |
| Central American Indians | 0.1 /100 | #291 | Tragic $41,474 |
| U.S. Virgin Islanders | 0.1 /100 | #292 | Tragic $41,448 |
| Immigrants | Zaire | 0.1 /100 | #293 | Tragic $41,325 |
| Potawatomi | 0.1 /100 | #294 | Tragic $41,288 |
| Bangladeshis | 0.1 /100 | #295 | Tragic $41,263 |
| Cherokee | 0.1 /100 | #296 | Tragic $41,252 |
| Guatemalans | 0.1 /100 | #297 | Tragic $41,205 |
| Immigrants | Micronesia | 0.1 /100 | #298 | Tragic $41,133 |
| Immigrants | Caribbean | 0.1 /100 | #299 | Tragic $41,119 |
| Ute | 0.1 /100 | #300 | Tragic $41,051 |
Demographics Similar to Alaska Natives by Median Earnings
In terms of median earnings, the demographic groups most similar to Alaska Natives are Tsimshian ($43,695, a difference of 0.13%), Hawaiian ($43,673, a difference of 0.18%), Malaysian ($43,844, a difference of 0.22%), Nepalese ($43,860, a difference of 0.25%), and Somali ($43,567, a difference of 0.42%).
| Demographics | Rating | Rank | Median Earnings |
| Sub-Saharan Africans | 3.7 /100 | #243 | Tragic $44,118 |
| Immigrants | Nonimmigrants | 3.7 /100 | #244 | Tragic $44,117 |
| Immigrants | Burma/Myanmar | 3.2 /100 | #245 | Tragic $43,998 |
| Immigrants | West Indies | 3.1 /100 | #246 | Tragic $43,989 |
| Immigrants | Cabo Verde | 3.0 /100 | #247 | Tragic $43,963 |
| Nepalese | 2.6 /100 | #248 | Tragic $43,860 |
| Malaysians | 2.6 /100 | #249 | Tragic $43,844 |
| Alaska Natives | 2.3 /100 | #250 | Tragic $43,750 |
| Tsimshian | 2.1 /100 | #251 | Tragic $43,695 |
| Hawaiians | 2.0 /100 | #252 | Tragic $43,673 |
| Somalis | 1.8 /100 | #253 | Tragic $43,567 |
| Liberians | 1.7 /100 | #254 | Tragic $43,536 |
| Immigrants | Middle Africa | 1.4 /100 | #255 | Tragic $43,416 |
| Alaskan Athabascans | 1.4 /100 | #256 | Tragic $43,393 |
| Jamaicans | 1.3 /100 | #257 | Tragic $43,343 |