Dutch West Indian vs Immigrants from Eritrea Median Earnings
COMPARE
Dutch West Indian
Immigrants from Eritrea
Median Earnings
Median Earnings Comparison
Dutch West Indians
Immigrants from Eritrea
$40,107
MEDIAN EARNINGS
0.0/ 100
METRIC RATING
318th/ 347
METRIC RANK
$47,657
MEDIAN EARNINGS
84.8/ 100
METRIC RATING
148th/ 347
METRIC RANK
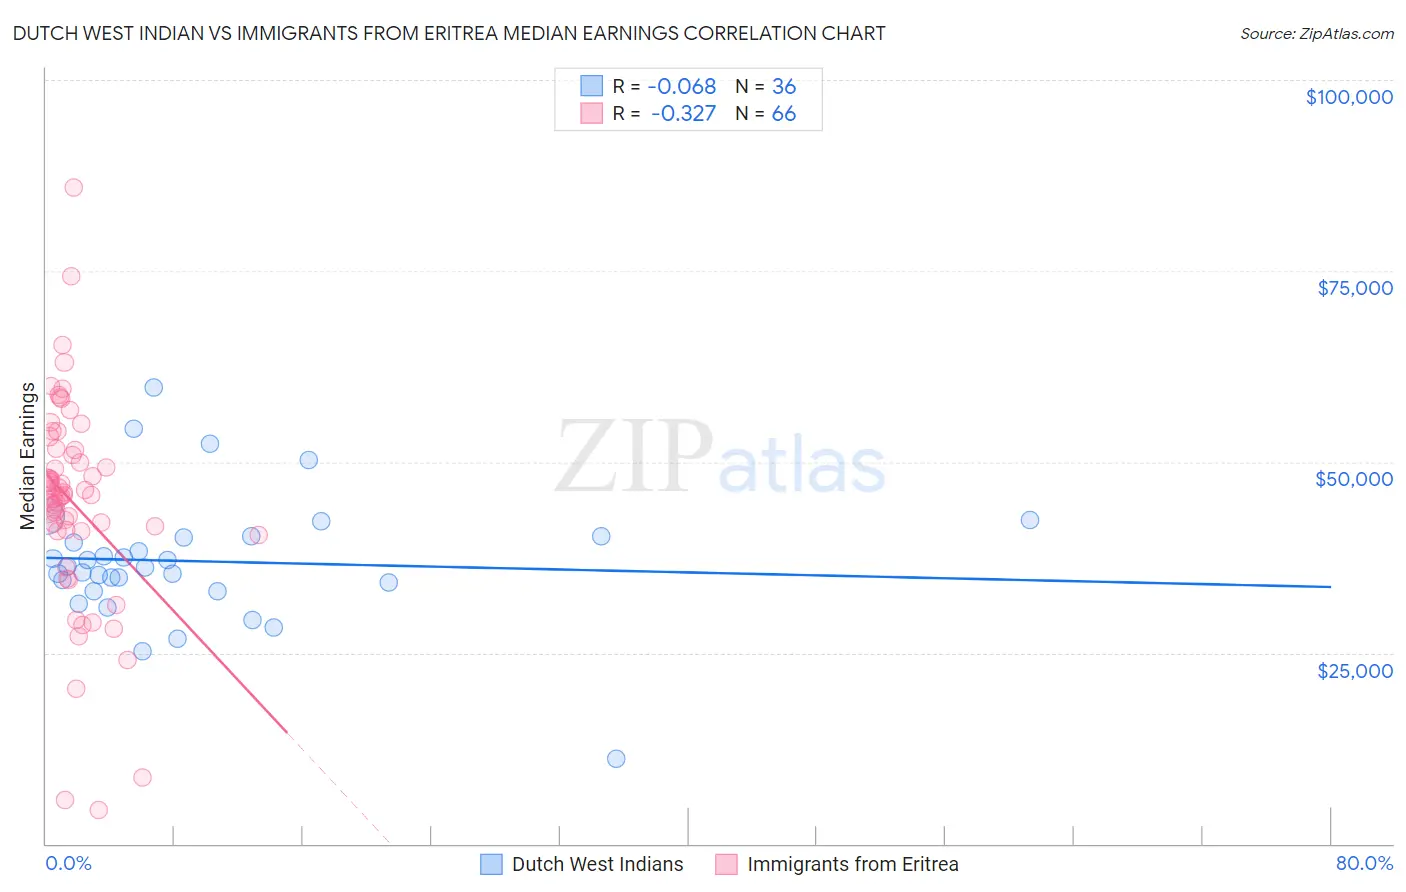
Dutch West Indian vs Immigrants from Eritrea Median Earnings Correlation Chart
The statistical analysis conducted on geographies consisting of 85,770,657 people shows a slight negative correlation between the proportion of Dutch West Indians and median earnings in the United States with a correlation coefficient (R) of -0.068 and weighted average of $40,107. Similarly, the statistical analysis conducted on geographies consisting of 104,854,314 people shows a mild negative correlation between the proportion of Immigrants from Eritrea and median earnings in the United States with a correlation coefficient (R) of -0.327 and weighted average of $47,657, a difference of 18.8%.
Median Earnings Correlation Summary
| Measurement | Dutch West Indian | Immigrants from Eritrea |
| Minimum | $11,071 | $4,426 |
| Maximum | $59,688 | $85,924 |
| Range | $48,617 | $81,498 |
| Mean | $36,968 | $44,557 |
| Median | $36,241 | $45,626 |
| Interquartile 25% (IQ1) | $33,646 | $40,964 |
| Interquartile 75% (IQ3) | $40,145 | $51,547 |
| Interquartile Range (IQR) | $6,499 | $10,583 |
| Standard Deviation (Sample) | $8,507 | $13,912 |
| Standard Deviation (Population) | $8,388 | $13,806 |
Similar Demographics by Median Earnings
Demographics Similar to Dutch West Indians by Median Earnings
In terms of median earnings, the demographic groups most similar to Dutch West Indians are Black/African American ($40,085, a difference of 0.060%), Fijian ($40,193, a difference of 0.21%), Immigrants from Honduras ($40,195, a difference of 0.22%), Cheyenne ($40,233, a difference of 0.31%), and Seminole ($40,233, a difference of 0.31%).
| Demographics | Rating | Rank | Median Earnings |
| Hispanics or Latinos | 0.0 /100 | #311 | Tragic $40,288 |
| Chippewa | 0.0 /100 | #312 | Tragic $40,287 |
| Choctaw | 0.0 /100 | #313 | Tragic $40,270 |
| Cheyenne | 0.0 /100 | #314 | Tragic $40,233 |
| Seminole | 0.0 /100 | #315 | Tragic $40,233 |
| Immigrants | Honduras | 0.0 /100 | #316 | Tragic $40,195 |
| Fijians | 0.0 /100 | #317 | Tragic $40,193 |
| Dutch West Indians | 0.0 /100 | #318 | Tragic $40,107 |
| Blacks/African Americans | 0.0 /100 | #319 | Tragic $40,085 |
| Immigrants | Bahamas | 0.0 /100 | #320 | Tragic $39,861 |
| Mexicans | 0.0 /100 | #321 | Tragic $39,834 |
| Immigrants | Central America | 0.0 /100 | #322 | Tragic $39,762 |
| Bahamians | 0.0 /100 | #323 | Tragic $39,735 |
| Ottawa | 0.0 /100 | #324 | Tragic $39,721 |
| Creek | 0.0 /100 | #325 | Tragic $39,648 |
Demographics Similar to Immigrants from Eritrea by Median Earnings
In terms of median earnings, the demographic groups most similar to Immigrants from Eritrea are Immigrants from South Eastern Asia ($47,671, a difference of 0.030%), Luxembourger ($47,640, a difference of 0.040%), Peruvian ($47,628, a difference of 0.060%), Immigrants from Chile ($47,697, a difference of 0.080%), and Immigrants from Oceania ($47,617, a difference of 0.080%).
| Demographics | Rating | Rank | Median Earnings |
| Immigrants | Sierra Leone | 88.3 /100 | #141 | Excellent $47,875 |
| Ugandans | 88.0 /100 | #142 | Excellent $47,854 |
| Swedes | 88.0 /100 | #143 | Excellent $47,851 |
| Hungarians | 87.1 /100 | #144 | Excellent $47,795 |
| Immigrants | Saudi Arabia | 85.6 /100 | #145 | Excellent $47,704 |
| Immigrants | Chile | 85.5 /100 | #146 | Excellent $47,697 |
| Immigrants | South Eastern Asia | 85.0 /100 | #147 | Excellent $47,671 |
| Immigrants | Eritrea | 84.8 /100 | #148 | Excellent $47,657 |
| Luxembourgers | 84.5 /100 | #149 | Excellent $47,640 |
| Peruvians | 84.2 /100 | #150 | Excellent $47,628 |
| Immigrants | Oceania | 84.1 /100 | #151 | Excellent $47,617 |
| Immigrants | Germany | 83.1 /100 | #152 | Excellent $47,566 |
| Slavs | 81.1 /100 | #153 | Excellent $47,470 |
| Immigrants | Portugal | 77.3 /100 | #154 | Good $47,304 |
| Immigrants | Vietnam | 76.7 /100 | #155 | Good $47,282 |