Immigrants from Zaire vs Serbian Median Earnings
COMPARE
Immigrants from Zaire
Serbian
Median Earnings
Median Earnings Comparison
Immigrants from Zaire
Serbians
$41,325
MEDIAN EARNINGS
0.1/ 100
METRIC RATING
293rd/ 347
METRIC RANK
$48,677
MEDIAN EARNINGS
95.9/ 100
METRIC RATING
117th/ 347
METRIC RANK
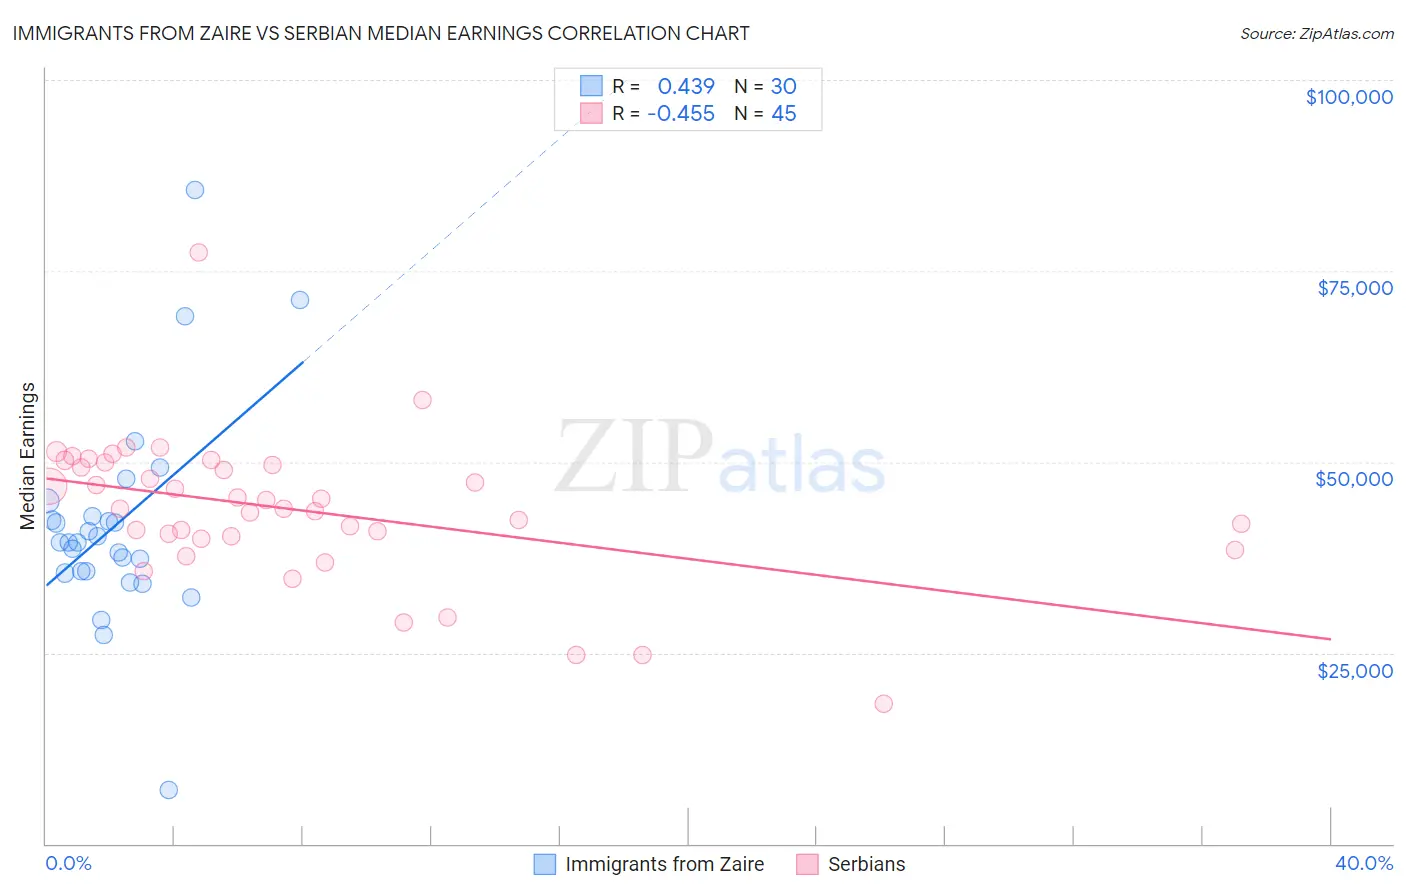
Immigrants from Zaire vs Serbian Median Earnings Correlation Chart
The statistical analysis conducted on geographies consisting of 107,255,584 people shows a moderate positive correlation between the proportion of Immigrants from Zaire and median earnings in the United States with a correlation coefficient (R) of 0.439 and weighted average of $41,325. Similarly, the statistical analysis conducted on geographies consisting of 267,654,810 people shows a moderate negative correlation between the proportion of Serbians and median earnings in the United States with a correlation coefficient (R) of -0.455 and weighted average of $48,677, a difference of 17.8%.
Median Earnings Correlation Summary
| Measurement | Immigrants from Zaire | Serbian |
| Minimum | $7,065 | $18,250 |
| Maximum | $85,536 | $77,452 |
| Range | $78,471 | $59,202 |
| Mean | $41,788 | $43,689 |
| Median | $39,475 | $43,879 |
| Interquartile 25% (IQ1) | $35,616 | $40,125 |
| Interquartile 75% (IQ3) | $42,826 | $49,731 |
| Interquartile Range (IQR) | $7,210 | $9,606 |
| Standard Deviation (Sample) | $14,049 | $9,625 |
| Standard Deviation (Population) | $13,813 | $9,517 |
Similar Demographics by Median Earnings
Demographics Similar to Immigrants from Zaire by Median Earnings
In terms of median earnings, the demographic groups most similar to Immigrants from Zaire are Potawatomi ($41,288, a difference of 0.090%), Bangladeshi ($41,263, a difference of 0.15%), Cherokee ($41,252, a difference of 0.18%), Guatemalan ($41,205, a difference of 0.29%), and U.S. Virgin Islander ($41,448, a difference of 0.30%).
| Demographics | Rating | Rank | Median Earnings |
| Mexican American Indians | 0.1 /100 | #286 | Tragic $41,719 |
| Indonesians | 0.1 /100 | #287 | Tragic $41,701 |
| Immigrants | Dominican Republic | 0.1 /100 | #288 | Tragic $41,554 |
| Comanche | 0.1 /100 | #289 | Tragic $41,519 |
| Paiute | 0.1 /100 | #290 | Tragic $41,508 |
| Central American Indians | 0.1 /100 | #291 | Tragic $41,474 |
| U.S. Virgin Islanders | 0.1 /100 | #292 | Tragic $41,448 |
| Immigrants | Zaire | 0.1 /100 | #293 | Tragic $41,325 |
| Potawatomi | 0.1 /100 | #294 | Tragic $41,288 |
| Bangladeshis | 0.1 /100 | #295 | Tragic $41,263 |
| Cherokee | 0.1 /100 | #296 | Tragic $41,252 |
| Guatemalans | 0.1 /100 | #297 | Tragic $41,205 |
| Immigrants | Micronesia | 0.1 /100 | #298 | Tragic $41,133 |
| Immigrants | Caribbean | 0.1 /100 | #299 | Tragic $41,119 |
| Ute | 0.1 /100 | #300 | Tragic $41,051 |
Demographics Similar to Serbians by Median Earnings
In terms of median earnings, the demographic groups most similar to Serbians are Immigrants from Jordan ($48,673, a difference of 0.010%), Polish ($48,659, a difference of 0.040%), Korean ($48,727, a difference of 0.10%), Carpatho Rusyn ($48,617, a difference of 0.12%), and Arab ($48,599, a difference of 0.16%).
| Demographics | Rating | Rank | Median Earnings |
| Immigrants | Ethiopia | 97.1 /100 | #110 | Exceptional $48,924 |
| Immigrants | Zimbabwe | 97.0 /100 | #111 | Exceptional $48,913 |
| Northern Europeans | 96.9 /100 | #112 | Exceptional $48,887 |
| Immigrants | Kuwait | 96.8 /100 | #113 | Exceptional $48,861 |
| Moroccans | 96.7 /100 | #114 | Exceptional $48,838 |
| Chinese | 96.7 /100 | #115 | Exceptional $48,836 |
| Koreans | 96.2 /100 | #116 | Exceptional $48,727 |
| Serbians | 95.9 /100 | #117 | Exceptional $48,677 |
| Immigrants | Jordan | 95.9 /100 | #118 | Exceptional $48,673 |
| Poles | 95.8 /100 | #119 | Exceptional $48,659 |
| Carpatho Rusyns | 95.5 /100 | #120 | Exceptional $48,617 |
| Arabs | 95.4 /100 | #121 | Exceptional $48,599 |
| Chileans | 94.8 /100 | #122 | Exceptional $48,504 |
| Immigrants | Syria | 93.9 /100 | #123 | Exceptional $48,375 |
| Brazilians | 93.7 /100 | #124 | Exceptional $48,356 |