White/Caucasian vs Immigrants from Eritrea Median Earnings
COMPARE
White/Caucasian
Immigrants from Eritrea
Median Earnings
Median Earnings Comparison
Whites/Caucasians
Immigrants from Eritrea
$45,197
MEDIAN EARNINGS
15.0/ 100
METRIC RATING
223rd/ 347
METRIC RANK
$47,657
MEDIAN EARNINGS
84.8/ 100
METRIC RATING
148th/ 347
METRIC RANK
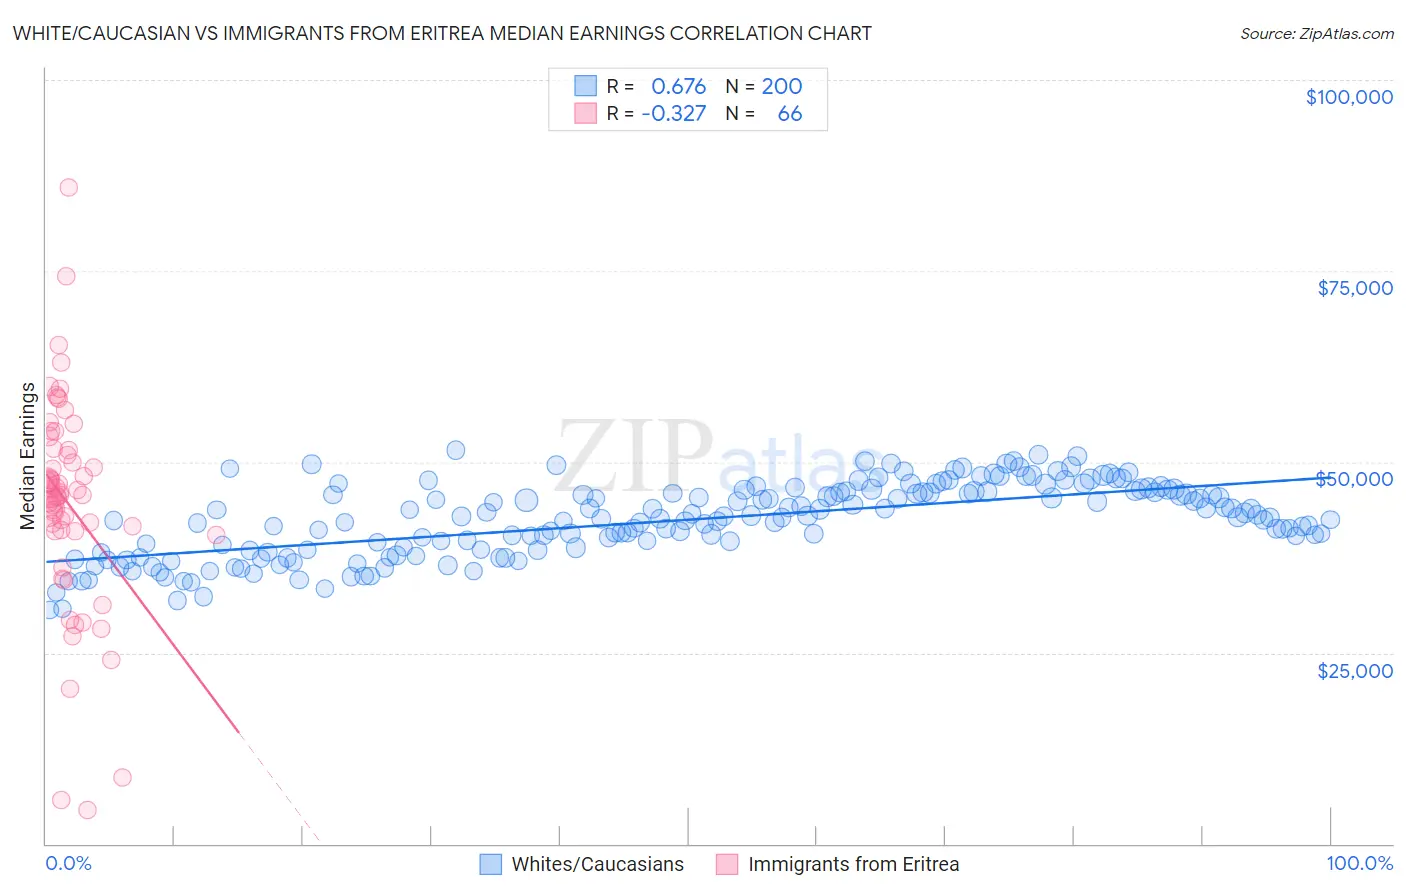
White/Caucasian vs Immigrants from Eritrea Median Earnings Correlation Chart
The statistical analysis conducted on geographies consisting of 584,189,858 people shows a significant positive correlation between the proportion of Whites/Caucasians and median earnings in the United States with a correlation coefficient (R) of 0.676 and weighted average of $45,197. Similarly, the statistical analysis conducted on geographies consisting of 104,854,314 people shows a mild negative correlation between the proportion of Immigrants from Eritrea and median earnings in the United States with a correlation coefficient (R) of -0.327 and weighted average of $47,657, a difference of 5.4%.
Median Earnings Correlation Summary
| Measurement | White/Caucasian | Immigrants from Eritrea |
| Minimum | $30,625 | $4,426 |
| Maximum | $51,538 | $85,924 |
| Range | $20,913 | $81,498 |
| Mean | $42,432 | $44,557 |
| Median | $42,807 | $45,626 |
| Interquartile 25% (IQ1) | $38,641 | $40,964 |
| Interquartile 75% (IQ3) | $46,089 | $51,547 |
| Interquartile Range (IQR) | $7,448 | $10,583 |
| Standard Deviation (Sample) | $4,733 | $13,912 |
| Standard Deviation (Population) | $4,721 | $13,806 |
Similar Demographics by Median Earnings
Demographics Similar to Whites/Caucasians by Median Earnings
In terms of median earnings, the demographic groups most similar to Whites/Caucasians are Immigrants from Panama ($45,198, a difference of 0.0%), Immigrants from Guyana ($45,204, a difference of 0.020%), Ecuadorian ($45,214, a difference of 0.040%), West Indian ($45,132, a difference of 0.15%), and Immigrants from Cambodia ($45,090, a difference of 0.24%).
| Demographics | Rating | Rank | Median Earnings |
| Guyanese | 20.6 /100 | #216 | Fair $45,470 |
| Tlingit-Haida | 20.5 /100 | #217 | Fair $45,468 |
| Spanish | 19.7 /100 | #218 | Poor $45,432 |
| Dutch | 18.4 /100 | #219 | Poor $45,370 |
| Ecuadorians | 15.3 /100 | #220 | Poor $45,214 |
| Immigrants | Guyana | 15.1 /100 | #221 | Poor $45,204 |
| Immigrants | Panama | 15.0 /100 | #222 | Poor $45,198 |
| Whites/Caucasians | 15.0 /100 | #223 | Poor $45,197 |
| West Indians | 13.9 /100 | #224 | Poor $45,132 |
| Immigrants | Cambodia | 13.2 /100 | #225 | Poor $45,090 |
| Immigrants | Nigeria | 12.2 /100 | #226 | Poor $45,030 |
| Native Hawaiians | 12.2 /100 | #227 | Poor $45,027 |
| Immigrants | Iraq | 11.6 /100 | #228 | Poor $44,988 |
| Scotch-Irish | 10.7 /100 | #229 | Poor $44,924 |
| Immigrants | Western Africa | 10.3 /100 | #230 | Poor $44,893 |
Demographics Similar to Immigrants from Eritrea by Median Earnings
In terms of median earnings, the demographic groups most similar to Immigrants from Eritrea are Immigrants from South Eastern Asia ($47,671, a difference of 0.030%), Luxembourger ($47,640, a difference of 0.040%), Peruvian ($47,628, a difference of 0.060%), Immigrants from Chile ($47,697, a difference of 0.080%), and Immigrants from Oceania ($47,617, a difference of 0.080%).
| Demographics | Rating | Rank | Median Earnings |
| Immigrants | Sierra Leone | 88.3 /100 | #141 | Excellent $47,875 |
| Ugandans | 88.0 /100 | #142 | Excellent $47,854 |
| Swedes | 88.0 /100 | #143 | Excellent $47,851 |
| Hungarians | 87.1 /100 | #144 | Excellent $47,795 |
| Immigrants | Saudi Arabia | 85.6 /100 | #145 | Excellent $47,704 |
| Immigrants | Chile | 85.5 /100 | #146 | Excellent $47,697 |
| Immigrants | South Eastern Asia | 85.0 /100 | #147 | Excellent $47,671 |
| Immigrants | Eritrea | 84.8 /100 | #148 | Excellent $47,657 |
| Luxembourgers | 84.5 /100 | #149 | Excellent $47,640 |
| Peruvians | 84.2 /100 | #150 | Excellent $47,628 |
| Immigrants | Oceania | 84.1 /100 | #151 | Excellent $47,617 |
| Immigrants | Germany | 83.1 /100 | #152 | Excellent $47,566 |
| Slavs | 81.1 /100 | #153 | Excellent $47,470 |
| Immigrants | Portugal | 77.3 /100 | #154 | Good $47,304 |
| Immigrants | Vietnam | 76.7 /100 | #155 | Good $47,282 |