Immigrants from Zaire vs Immigrants from Philippines Median Earnings
COMPARE
Immigrants from Zaire
Immigrants from Philippines
Median Earnings
Median Earnings Comparison
Immigrants from Zaire
Immigrants from Philippines
$41,325
MEDIAN EARNINGS
0.1/ 100
METRIC RATING
293rd/ 347
METRIC RANK
$48,266
MEDIAN EARNINGS
92.9/ 100
METRIC RATING
128th/ 347
METRIC RANK
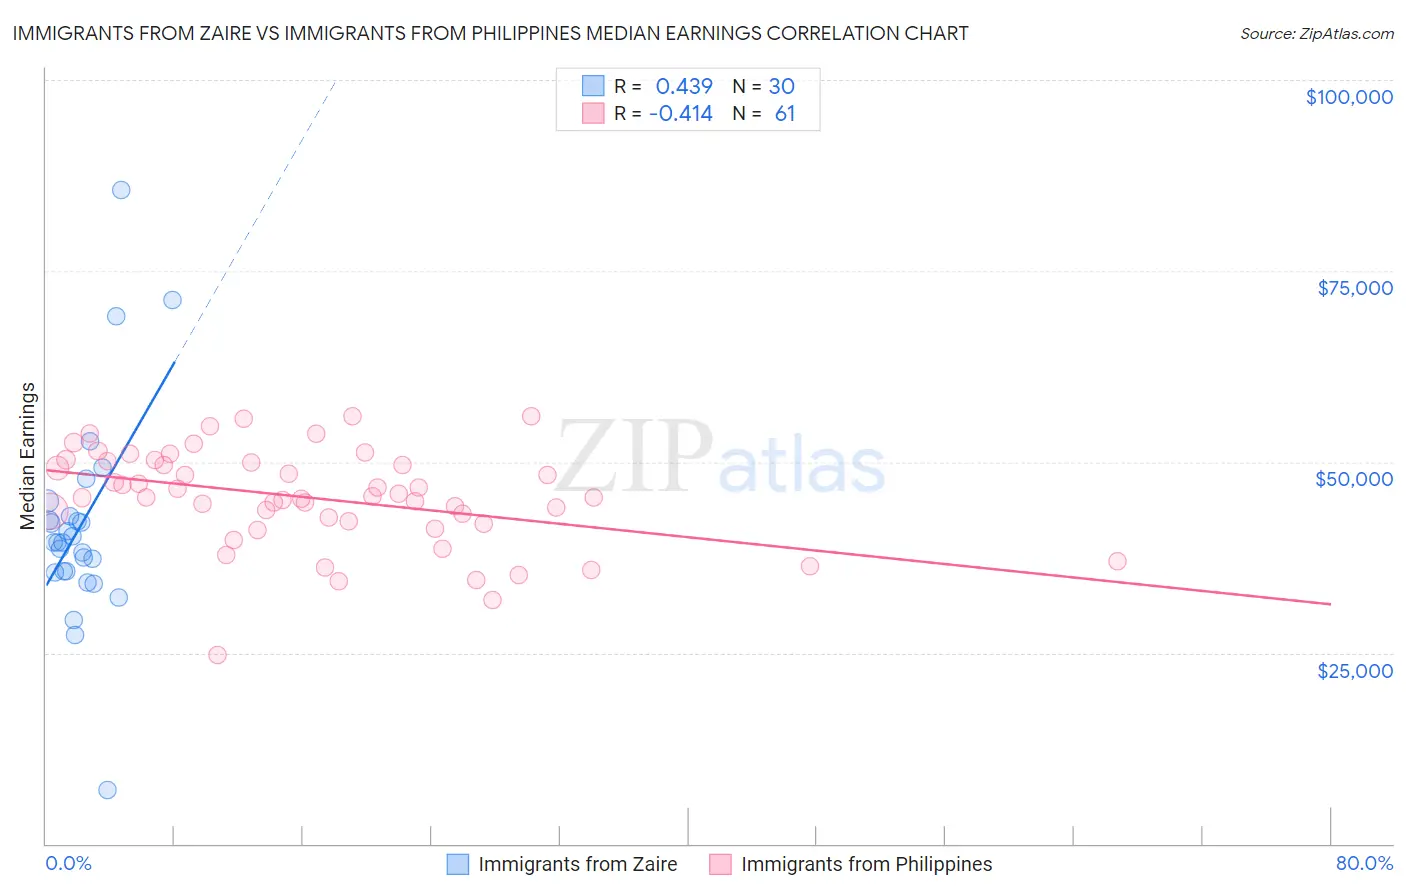
Immigrants from Zaire vs Immigrants from Philippines Median Earnings Correlation Chart
The statistical analysis conducted on geographies consisting of 107,255,584 people shows a moderate positive correlation between the proportion of Immigrants from Zaire and median earnings in the United States with a correlation coefficient (R) of 0.439 and weighted average of $41,325. Similarly, the statistical analysis conducted on geographies consisting of 471,239,871 people shows a moderate negative correlation between the proportion of Immigrants from Philippines and median earnings in the United States with a correlation coefficient (R) of -0.414 and weighted average of $48,266, a difference of 16.8%.
Median Earnings Correlation Summary
| Measurement | Immigrants from Zaire | Immigrants from Philippines |
| Minimum | $7,065 | $24,776 |
| Maximum | $85,536 | $55,949 |
| Range | $78,471 | $31,173 |
| Mean | $41,788 | $45,260 |
| Median | $39,475 | $45,398 |
| Interquartile 25% (IQ1) | $35,616 | $42,071 |
| Interquartile 75% (IQ3) | $42,826 | $50,000 |
| Interquartile Range (IQR) | $7,210 | $7,929 |
| Standard Deviation (Sample) | $14,049 | $6,408 |
| Standard Deviation (Population) | $13,813 | $6,355 |
Similar Demographics by Median Earnings
Demographics Similar to Immigrants from Zaire by Median Earnings
In terms of median earnings, the demographic groups most similar to Immigrants from Zaire are Potawatomi ($41,288, a difference of 0.090%), Bangladeshi ($41,263, a difference of 0.15%), Cherokee ($41,252, a difference of 0.18%), Guatemalan ($41,205, a difference of 0.29%), and U.S. Virgin Islander ($41,448, a difference of 0.30%).
| Demographics | Rating | Rank | Median Earnings |
| Mexican American Indians | 0.1 /100 | #286 | Tragic $41,719 |
| Indonesians | 0.1 /100 | #287 | Tragic $41,701 |
| Immigrants | Dominican Republic | 0.1 /100 | #288 | Tragic $41,554 |
| Comanche | 0.1 /100 | #289 | Tragic $41,519 |
| Paiute | 0.1 /100 | #290 | Tragic $41,508 |
| Central American Indians | 0.1 /100 | #291 | Tragic $41,474 |
| U.S. Virgin Islanders | 0.1 /100 | #292 | Tragic $41,448 |
| Immigrants | Zaire | 0.1 /100 | #293 | Tragic $41,325 |
| Potawatomi | 0.1 /100 | #294 | Tragic $41,288 |
| Bangladeshis | 0.1 /100 | #295 | Tragic $41,263 |
| Cherokee | 0.1 /100 | #296 | Tragic $41,252 |
| Guatemalans | 0.1 /100 | #297 | Tragic $41,205 |
| Immigrants | Micronesia | 0.1 /100 | #298 | Tragic $41,133 |
| Immigrants | Caribbean | 0.1 /100 | #299 | Tragic $41,119 |
| Ute | 0.1 /100 | #300 | Tragic $41,051 |
Demographics Similar to Immigrants from Philippines by Median Earnings
In terms of median earnings, the demographic groups most similar to Immigrants from Philippines are Pakistani ($48,254, a difference of 0.020%), Sierra Leonean ($48,286, a difference of 0.040%), Immigrants from Fiji ($48,305, a difference of 0.080%), Assyrian/Chaldean/Syriac ($48,304, a difference of 0.080%), and Zimbabwean ($48,229, a difference of 0.080%).
| Demographics | Rating | Rank | Median Earnings |
| Arabs | 95.4 /100 | #121 | Exceptional $48,599 |
| Chileans | 94.8 /100 | #122 | Exceptional $48,504 |
| Immigrants | Syria | 93.9 /100 | #123 | Exceptional $48,375 |
| Brazilians | 93.7 /100 | #124 | Exceptional $48,356 |
| Immigrants | Fiji | 93.3 /100 | #125 | Exceptional $48,305 |
| Assyrians/Chaldeans/Syriacs | 93.3 /100 | #126 | Exceptional $48,304 |
| Sierra Leoneans | 93.1 /100 | #127 | Exceptional $48,286 |
| Immigrants | Philippines | 92.9 /100 | #128 | Exceptional $48,266 |
| Pakistanis | 92.8 /100 | #129 | Exceptional $48,254 |
| Zimbabweans | 92.6 /100 | #130 | Exceptional $48,229 |
| Lebanese | 92.5 /100 | #131 | Exceptional $48,226 |
| British | 92.2 /100 | #132 | Exceptional $48,189 |
| Immigrants | Uganda | 90.5 /100 | #133 | Exceptional $48,041 |
| Sri Lankans | 90.5 /100 | #134 | Exceptional $48,040 |
| Portuguese | 90.4 /100 | #135 | Exceptional $48,032 |