American vs Immigrants from Eritrea Median Earnings
COMPARE
American
Immigrants from Eritrea
Median Earnings
Median Earnings Comparison
Americans
Immigrants from Eritrea
$42,742
MEDIAN EARNINGS
0.6/ 100
METRIC RATING
268th/ 347
METRIC RANK
$47,657
MEDIAN EARNINGS
84.8/ 100
METRIC RATING
148th/ 347
METRIC RANK
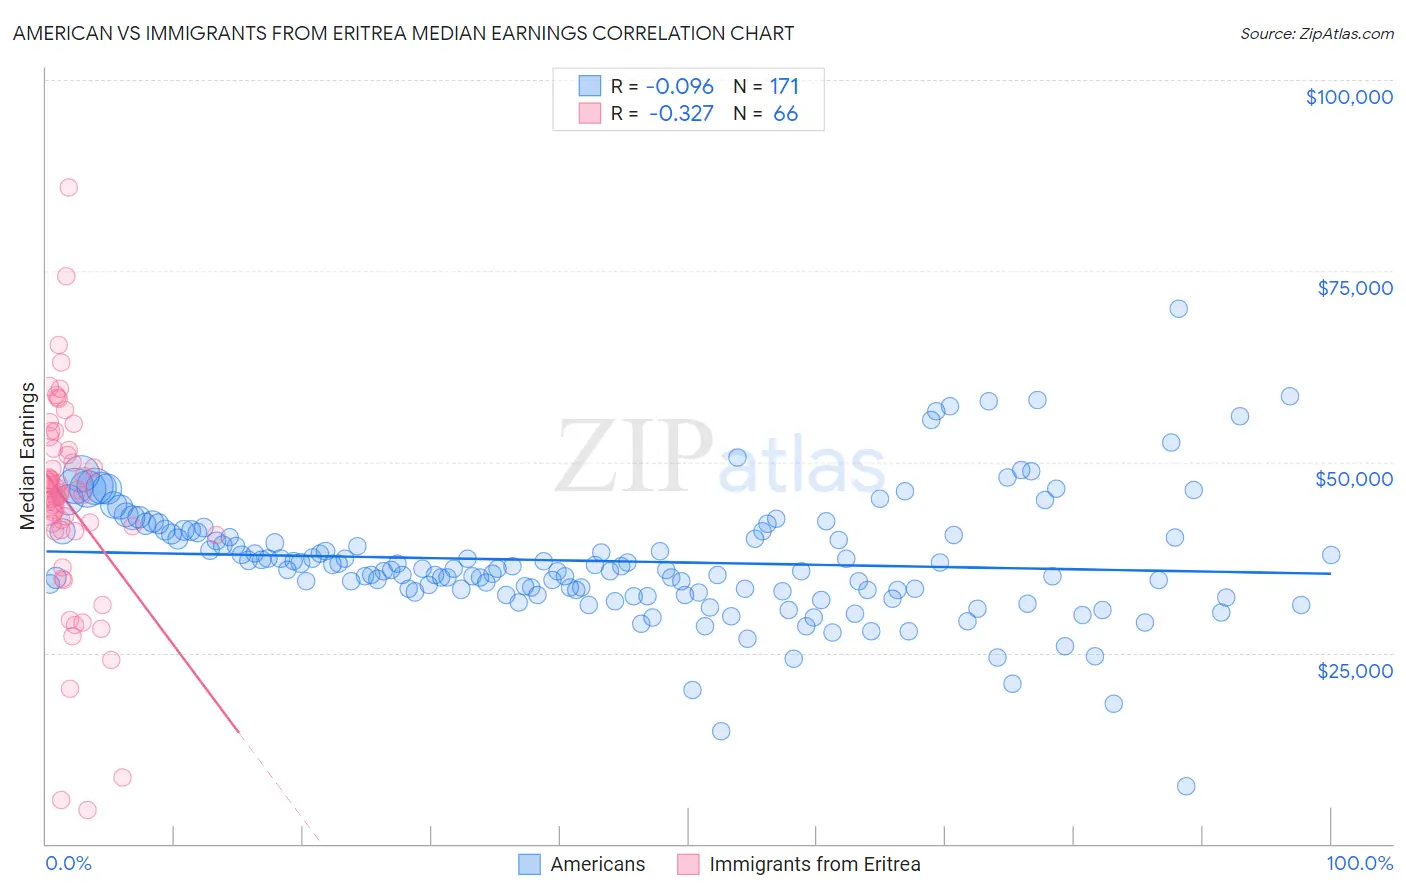
American vs Immigrants from Eritrea Median Earnings Correlation Chart
The statistical analysis conducted on geographies consisting of 581,345,964 people shows a slight negative correlation between the proportion of Americans and median earnings in the United States with a correlation coefficient (R) of -0.096 and weighted average of $42,742. Similarly, the statistical analysis conducted on geographies consisting of 104,854,314 people shows a mild negative correlation between the proportion of Immigrants from Eritrea and median earnings in the United States with a correlation coefficient (R) of -0.327 and weighted average of $47,657, a difference of 11.5%.
Median Earnings Correlation Summary
| Measurement | American | Immigrants from Eritrea |
| Minimum | $7,598 | $4,426 |
| Maximum | $70,000 | $85,924 |
| Range | $62,402 | $81,498 |
| Mean | $36,993 | $44,557 |
| Median | $35,919 | $45,626 |
| Interquartile 25% (IQ1) | $32,980 | $40,964 |
| Interquartile 75% (IQ3) | $40,815 | $51,547 |
| Interquartile Range (IQR) | $7,835 | $10,583 |
| Standard Deviation (Sample) | $8,064 | $13,912 |
| Standard Deviation (Population) | $8,040 | $13,806 |
Similar Demographics by Median Earnings
Demographics Similar to Americans by Median Earnings
In terms of median earnings, the demographic groups most similar to Americans are Cree ($42,777, a difference of 0.080%), Belizean ($42,702, a difference of 0.090%), Osage ($42,651, a difference of 0.21%), Pennsylvania German ($42,615, a difference of 0.30%), and Immigrants from Laos ($42,884, a difference of 0.33%).
| Demographics | Rating | Rank | Median Earnings |
| Immigrants | Jamaica | 0.8 /100 | #261 | Tragic $43,026 |
| Nicaraguans | 0.8 /100 | #262 | Tragic $43,026 |
| Inupiat | 0.8 /100 | #263 | Tragic $43,000 |
| Immigrants | Liberia | 0.7 /100 | #264 | Tragic $42,923 |
| Salvadorans | 0.7 /100 | #265 | Tragic $42,912 |
| Immigrants | Laos | 0.7 /100 | #266 | Tragic $42,884 |
| Cree | 0.6 /100 | #267 | Tragic $42,777 |
| Americans | 0.6 /100 | #268 | Tragic $42,742 |
| Belizeans | 0.5 /100 | #269 | Tragic $42,702 |
| Osage | 0.5 /100 | #270 | Tragic $42,651 |
| Pennsylvania Germans | 0.5 /100 | #271 | Tragic $42,615 |
| Iroquois | 0.4 /100 | #272 | Tragic $42,430 |
| Immigrants | Dominica | 0.4 /100 | #273 | Tragic $42,420 |
| Immigrants | El Salvador | 0.4 /100 | #274 | Tragic $42,413 |
| Immigrants | Belize | 0.3 /100 | #275 | Tragic $42,339 |
Demographics Similar to Immigrants from Eritrea by Median Earnings
In terms of median earnings, the demographic groups most similar to Immigrants from Eritrea are Immigrants from South Eastern Asia ($47,671, a difference of 0.030%), Luxembourger ($47,640, a difference of 0.040%), Peruvian ($47,628, a difference of 0.060%), Immigrants from Chile ($47,697, a difference of 0.080%), and Immigrants from Oceania ($47,617, a difference of 0.080%).
| Demographics | Rating | Rank | Median Earnings |
| Immigrants | Sierra Leone | 88.3 /100 | #141 | Excellent $47,875 |
| Ugandans | 88.0 /100 | #142 | Excellent $47,854 |
| Swedes | 88.0 /100 | #143 | Excellent $47,851 |
| Hungarians | 87.1 /100 | #144 | Excellent $47,795 |
| Immigrants | Saudi Arabia | 85.6 /100 | #145 | Excellent $47,704 |
| Immigrants | Chile | 85.5 /100 | #146 | Excellent $47,697 |
| Immigrants | South Eastern Asia | 85.0 /100 | #147 | Excellent $47,671 |
| Immigrants | Eritrea | 84.8 /100 | #148 | Excellent $47,657 |
| Luxembourgers | 84.5 /100 | #149 | Excellent $47,640 |
| Peruvians | 84.2 /100 | #150 | Excellent $47,628 |
| Immigrants | Oceania | 84.1 /100 | #151 | Excellent $47,617 |
| Immigrants | Germany | 83.1 /100 | #152 | Excellent $47,566 |
| Slavs | 81.1 /100 | #153 | Excellent $47,470 |
| Immigrants | Portugal | 77.3 /100 | #154 | Good $47,304 |
| Immigrants | Vietnam | 76.7 /100 | #155 | Good $47,282 |