Immigrants from Sudan vs Immigrants from Vietnam Wage/Income Gap
COMPARE
Immigrants from Sudan
Immigrants from Vietnam
Wage/Income Gap
Wage/Income Gap Comparison
Immigrants from Sudan
Immigrants from Vietnam
23.6%
WAGE/INCOME GAP
99.4/ 100
METRIC RATING
97th/ 347
METRIC RANK
25.2%
WAGE/INCOME GAP
77.7/ 100
METRIC RATING
155th/ 347
METRIC RANK
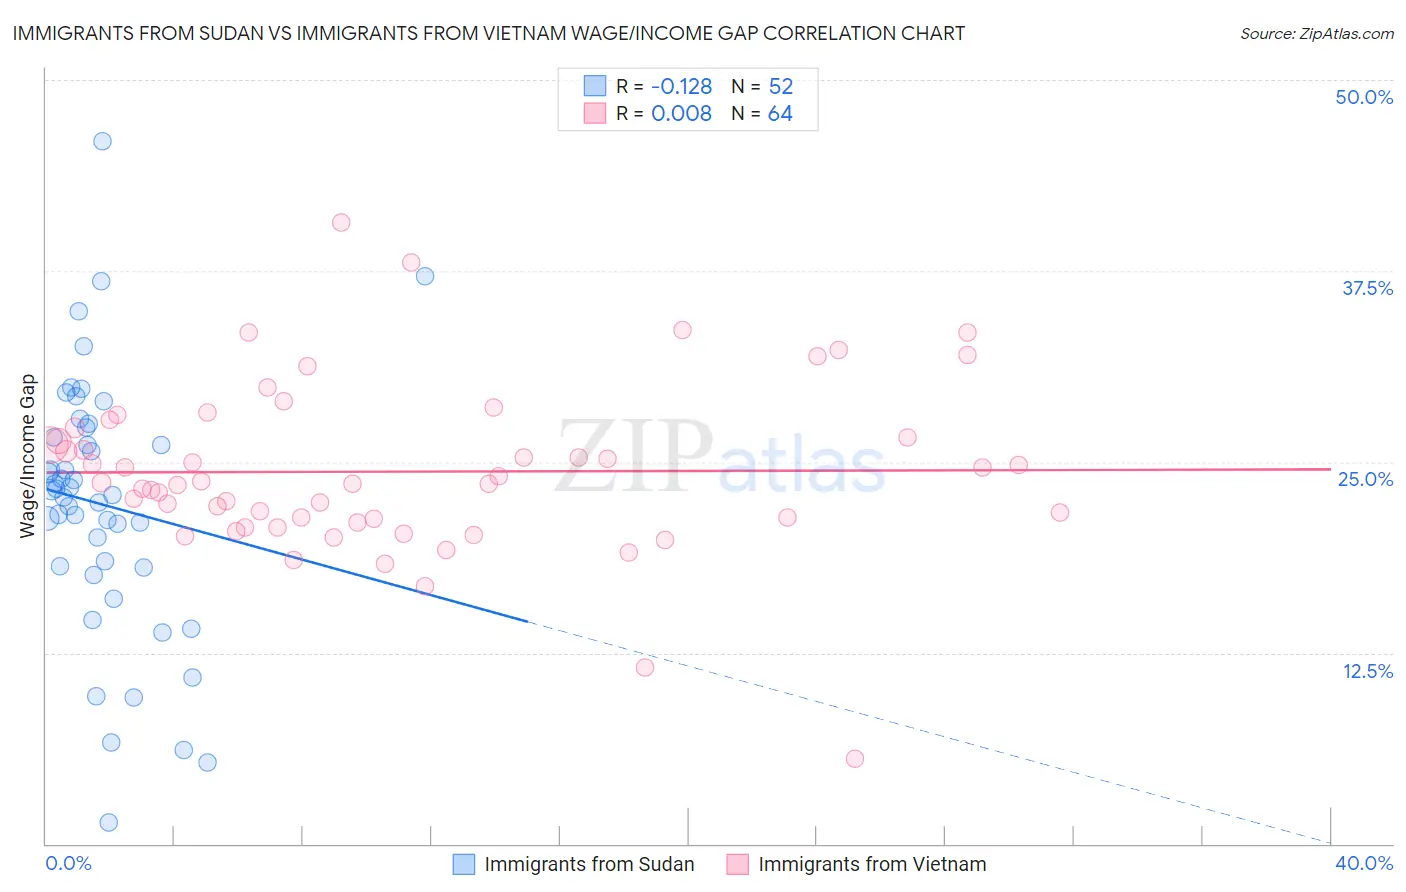
Immigrants from Sudan vs Immigrants from Vietnam Wage/Income Gap Correlation Chart
The statistical analysis conducted on geographies consisting of 118,934,661 people shows a poor negative correlation between the proportion of Immigrants from Sudan and wage/income gap percentage in the United States with a correlation coefficient (R) of -0.128 and weighted average of 23.6%. Similarly, the statistical analysis conducted on geographies consisting of 404,669,724 people shows no correlation between the proportion of Immigrants from Vietnam and wage/income gap percentage in the United States with a correlation coefficient (R) of 0.008 and weighted average of 25.2%, a difference of 6.8%.
Wage/Income Gap Correlation Summary
| Measurement | Immigrants from Sudan | Immigrants from Vietnam |
| Minimum | 1.4% | 5.6% |
| Maximum | 46.0% | 40.6% |
| Range | 44.6% | 35.1% |
| Mean | 22.2% | 24.4% |
| Median | 23.0% | 23.6% |
| Interquartile 25% (IQ1) | 18.1% | 21.1% |
| Interquartile 75% (IQ3) | 26.9% | 26.9% |
| Interquartile Range (IQR) | 8.8% | 5.8% |
| Standard Deviation (Sample) | 8.5% | 5.6% |
| Standard Deviation (Population) | 8.4% | 5.6% |
Similar Demographics by Wage/Income Gap
Demographics Similar to Immigrants from Sudan by Wage/Income Gap
In terms of wage/income gap, the demographic groups most similar to Immigrants from Sudan are Kiowa (23.6%, a difference of 0.090%), Cape Verdean (23.6%, a difference of 0.21%), Honduran (23.6%, a difference of 0.24%), Immigrants from Cabo Verde (23.6%, a difference of 0.33%), and Immigrants from Latin America (23.7%, a difference of 0.40%).
| Demographics | Rating | Rank | Wage/Income Gap |
| Nicaraguans | 99.6 /100 | #90 | Exceptional 23.4% |
| Arapaho | 99.6 /100 | #91 | Exceptional 23.5% |
| Immigrants | Honduras | 99.5 /100 | #92 | Exceptional 23.5% |
| Immigrants | Cabo Verde | 99.5 /100 | #93 | Exceptional 23.6% |
| Hondurans | 99.5 /100 | #94 | Exceptional 23.6% |
| Cape Verdeans | 99.4 /100 | #95 | Exceptional 23.6% |
| Kiowa | 99.4 /100 | #96 | Exceptional 23.6% |
| Immigrants | Sudan | 99.4 /100 | #97 | Exceptional 23.6% |
| Immigrants | Latin America | 99.2 /100 | #98 | Exceptional 23.7% |
| Aleuts | 99.2 /100 | #99 | Exceptional 23.7% |
| Yakama | 99.2 /100 | #100 | Exceptional 23.7% |
| Japanese | 99.1 /100 | #101 | Exceptional 23.8% |
| Immigrants | Laos | 99.0 /100 | #102 | Exceptional 23.8% |
| Tsimshian | 98.9 /100 | #103 | Exceptional 23.9% |
| Tlingit-Haida | 98.7 /100 | #104 | Exceptional 24.0% |
Demographics Similar to Immigrants from Vietnam by Wage/Income Gap
In terms of wage/income gap, the demographic groups most similar to Immigrants from Vietnam are Blackfeet (25.2%, a difference of 0.040%), Immigrants from Northern Africa (25.2%, a difference of 0.040%), Immigrants from Mexico (25.3%, a difference of 0.12%), Costa Rican (25.3%, a difference of 0.18%), and Immigrants from Zimbabwe (25.3%, a difference of 0.36%).
| Demographics | Rating | Rank | Wage/Income Gap |
| Iroquois | 83.9 /100 | #148 | Excellent 25.1% |
| Immigrants | Peru | 82.6 /100 | #149 | Excellent 25.1% |
| Immigrants | Immigrants | 82.3 /100 | #150 | Excellent 25.1% |
| Taiwanese | 81.6 /100 | #151 | Excellent 25.1% |
| Uruguayans | 81.3 /100 | #152 | Excellent 25.2% |
| Blackfeet | 78.1 /100 | #153 | Good 25.2% |
| Immigrants | Northern Africa | 78.1 /100 | #154 | Good 25.2% |
| Immigrants | Vietnam | 77.7 /100 | #155 | Good 25.2% |
| Immigrants | Mexico | 76.4 /100 | #156 | Good 25.3% |
| Costa Ricans | 75.8 /100 | #157 | Good 25.3% |
| Immigrants | Zimbabwe | 73.7 /100 | #158 | Good 25.3% |
| Puget Sound Salish | 73.0 /100 | #159 | Good 25.3% |
| French American Indians | 72.5 /100 | #160 | Good 25.4% |
| Albanians | 69.4 /100 | #161 | Good 25.4% |
| Shoshone | 69.0 /100 | #162 | Good 25.4% |