Immigrants from Sudan vs Venezuelan Wage/Income Gap
COMPARE
Immigrants from Sudan
Venezuelan
Wage/Income Gap
Wage/Income Gap Comparison
Immigrants from Sudan
Venezuelans
23.6%
WAGE/INCOME GAP
99.4/ 100
METRIC RATING
97th/ 347
METRIC RANK
26.3%
WAGE/INCOME GAP
21.5/ 100
METRIC RATING
198th/ 347
METRIC RANK
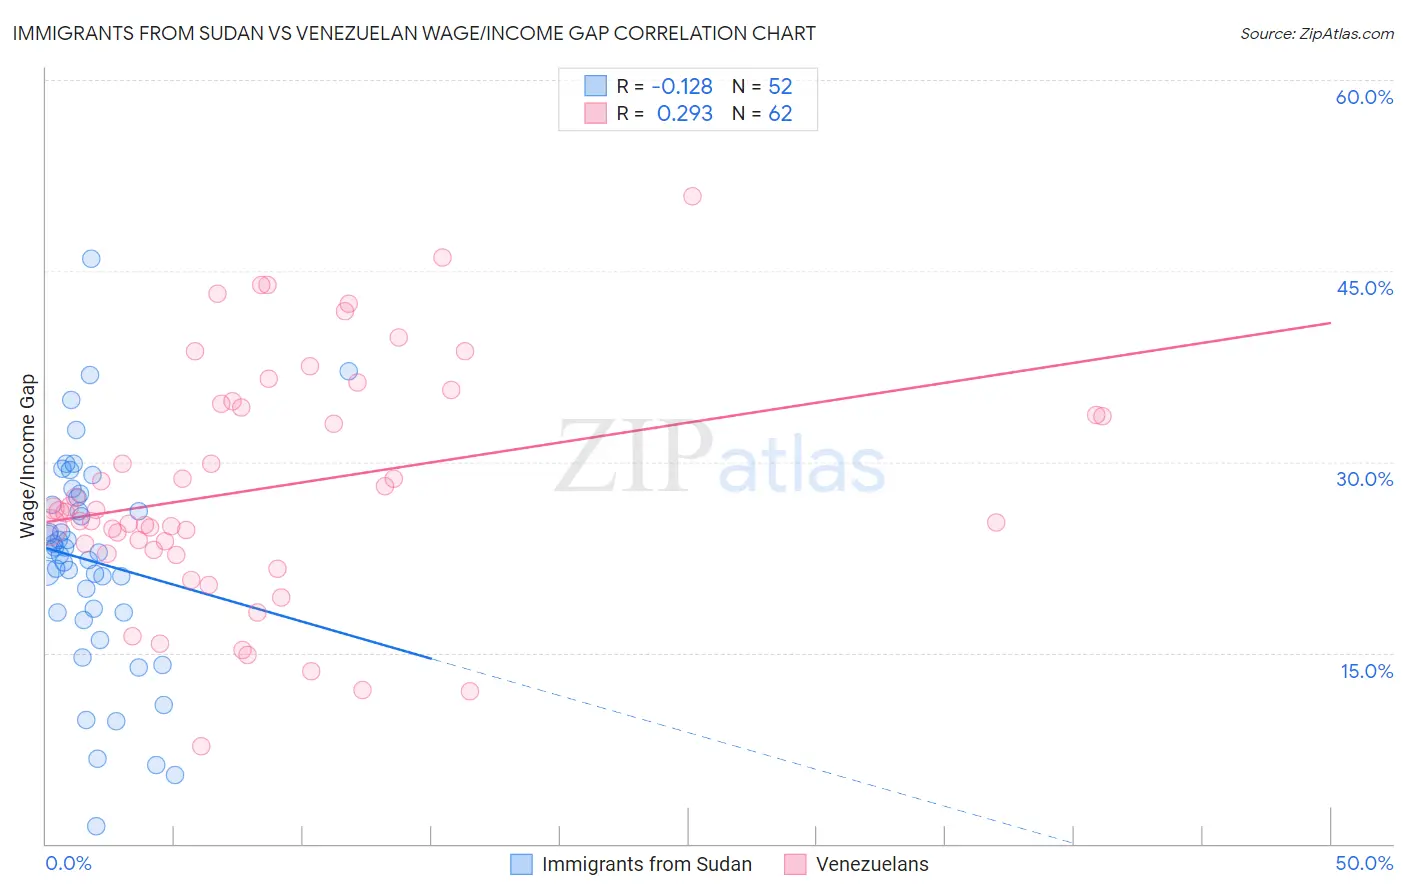
Immigrants from Sudan vs Venezuelan Wage/Income Gap Correlation Chart
The statistical analysis conducted on geographies consisting of 118,934,661 people shows a poor negative correlation between the proportion of Immigrants from Sudan and wage/income gap percentage in the United States with a correlation coefficient (R) of -0.128 and weighted average of 23.6%. Similarly, the statistical analysis conducted on geographies consisting of 306,223,372 people shows a weak positive correlation between the proportion of Venezuelans and wage/income gap percentage in the United States with a correlation coefficient (R) of 0.293 and weighted average of 26.3%, a difference of 11.3%.
Wage/Income Gap Correlation Summary
| Measurement | Immigrants from Sudan | Venezuelan |
| Minimum | 1.4% | 7.6% |
| Maximum | 46.0% | 50.8% |
| Range | 44.6% | 43.2% |
| Mean | 22.2% | 27.9% |
| Median | 23.0% | 26.1% |
| Interquartile 25% (IQ1) | 18.1% | 23.1% |
| Interquartile 75% (IQ3) | 26.9% | 34.6% |
| Interquartile Range (IQR) | 8.8% | 11.4% |
| Standard Deviation (Sample) | 8.5% | 9.2% |
| Standard Deviation (Population) | 8.4% | 9.2% |
Similar Demographics by Wage/Income Gap
Demographics Similar to Immigrants from Sudan by Wage/Income Gap
In terms of wage/income gap, the demographic groups most similar to Immigrants from Sudan are Kiowa (23.6%, a difference of 0.090%), Cape Verdean (23.6%, a difference of 0.21%), Honduran (23.6%, a difference of 0.24%), Immigrants from Cabo Verde (23.6%, a difference of 0.33%), and Immigrants from Latin America (23.7%, a difference of 0.40%).
| Demographics | Rating | Rank | Wage/Income Gap |
| Nicaraguans | 99.6 /100 | #90 | Exceptional 23.4% |
| Arapaho | 99.6 /100 | #91 | Exceptional 23.5% |
| Immigrants | Honduras | 99.5 /100 | #92 | Exceptional 23.5% |
| Immigrants | Cabo Verde | 99.5 /100 | #93 | Exceptional 23.6% |
| Hondurans | 99.5 /100 | #94 | Exceptional 23.6% |
| Cape Verdeans | 99.4 /100 | #95 | Exceptional 23.6% |
| Kiowa | 99.4 /100 | #96 | Exceptional 23.6% |
| Immigrants | Sudan | 99.4 /100 | #97 | Exceptional 23.6% |
| Immigrants | Latin America | 99.2 /100 | #98 | Exceptional 23.7% |
| Aleuts | 99.2 /100 | #99 | Exceptional 23.7% |
| Yakama | 99.2 /100 | #100 | Exceptional 23.7% |
| Japanese | 99.1 /100 | #101 | Exceptional 23.8% |
| Immigrants | Laos | 99.0 /100 | #102 | Exceptional 23.8% |
| Tsimshian | 98.9 /100 | #103 | Exceptional 23.9% |
| Tlingit-Haida | 98.7 /100 | #104 | Exceptional 24.0% |
Demographics Similar to Venezuelans by Wage/Income Gap
In terms of wage/income gap, the demographic groups most similar to Venezuelans are Zimbabwean (26.3%, a difference of 0.010%), Immigrants from Western Asia (26.3%, a difference of 0.020%), Dutch West Indian (26.3%, a difference of 0.050%), Delaware (26.3%, a difference of 0.050%), and Immigrants from Malaysia (26.3%, a difference of 0.070%).
| Demographics | Rating | Rank | Wage/Income Gap |
| Immigrants | Venezuela | 24.7 /100 | #191 | Fair 26.2% |
| Immigrants | Bulgaria | 22.5 /100 | #192 | Fair 26.3% |
| Immigrants | Jordan | 22.4 /100 | #193 | Fair 26.3% |
| Chileans | 22.3 /100 | #194 | Fair 26.3% |
| Immigrants | Malaysia | 22.2 /100 | #195 | Fair 26.3% |
| Immigrants | Western Asia | 21.7 /100 | #196 | Fair 26.3% |
| Zimbabweans | 21.6 /100 | #197 | Fair 26.3% |
| Venezuelans | 21.5 /100 | #198 | Fair 26.3% |
| Dutch West Indians | 21.0 /100 | #199 | Fair 26.3% |
| Delaware | 20.9 /100 | #200 | Fair 26.3% |
| Immigrants | Syria | 19.3 /100 | #201 | Poor 26.4% |
| Laotians | 19.2 /100 | #202 | Poor 26.4% |
| Immigrants | Eastern Europe | 19.2 /100 | #203 | Poor 26.4% |
| Immigrants | Russia | 19.0 /100 | #204 | Poor 26.4% |
| Immigrants | Southern Europe | 17.3 /100 | #205 | Poor 26.4% |