Immigrants from Sudan vs Immigrants from Europe Wage/Income Gap
COMPARE
Immigrants from Sudan
Immigrants from Europe
Wage/Income Gap
Wage/Income Gap Comparison
Immigrants from Sudan
Immigrants from Europe
23.6%
WAGE/INCOME GAP
99.4/ 100
METRIC RATING
97th/ 347
METRIC RANK
27.1%
WAGE/INCOME GAP
3.8/ 100
METRIC RATING
240th/ 347
METRIC RANK
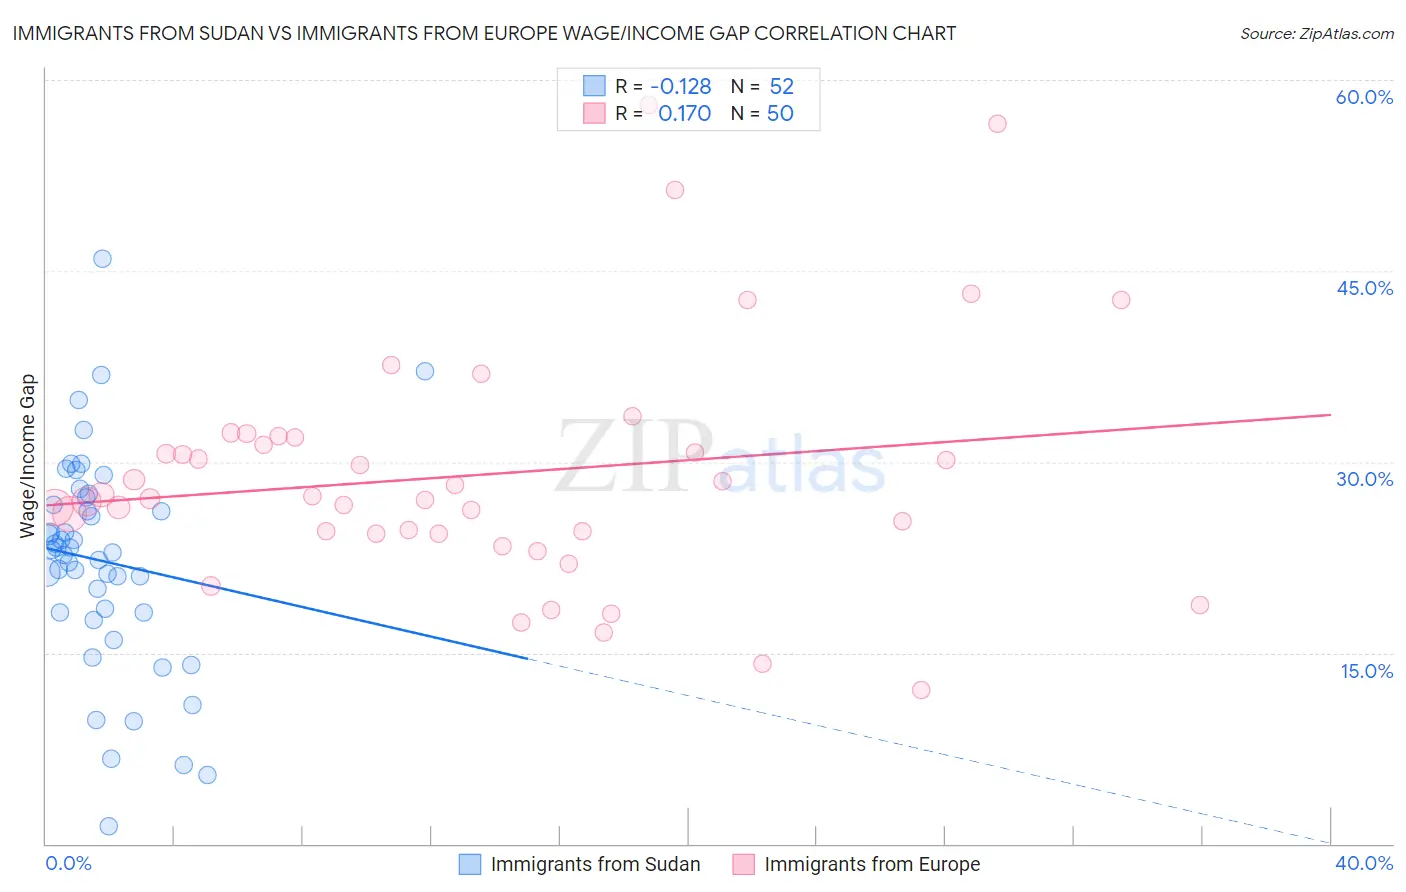
Immigrants from Sudan vs Immigrants from Europe Wage/Income Gap Correlation Chart
The statistical analysis conducted on geographies consisting of 118,934,661 people shows a poor negative correlation between the proportion of Immigrants from Sudan and wage/income gap percentage in the United States with a correlation coefficient (R) of -0.128 and weighted average of 23.6%. Similarly, the statistical analysis conducted on geographies consisting of 545,787,785 people shows a poor positive correlation between the proportion of Immigrants from Europe and wage/income gap percentage in the United States with a correlation coefficient (R) of 0.170 and weighted average of 27.1%, a difference of 14.8%.
Wage/Income Gap Correlation Summary
| Measurement | Immigrants from Sudan | Immigrants from Europe |
| Minimum | 1.4% | 12.1% |
| Maximum | 46.0% | 58.0% |
| Range | 44.6% | 46.0% |
| Mean | 22.2% | 29.0% |
| Median | 23.0% | 27.2% |
| Interquartile 25% (IQ1) | 18.1% | 24.4% |
| Interquartile 75% (IQ3) | 26.9% | 32.0% |
| Interquartile Range (IQR) | 8.8% | 7.6% |
| Standard Deviation (Sample) | 8.5% | 9.5% |
| Standard Deviation (Population) | 8.4% | 9.4% |
Similar Demographics by Wage/Income Gap
Demographics Similar to Immigrants from Sudan by Wage/Income Gap
In terms of wage/income gap, the demographic groups most similar to Immigrants from Sudan are Kiowa (23.6%, a difference of 0.090%), Cape Verdean (23.6%, a difference of 0.21%), Honduran (23.6%, a difference of 0.24%), Immigrants from Cabo Verde (23.6%, a difference of 0.33%), and Immigrants from Latin America (23.7%, a difference of 0.40%).
| Demographics | Rating | Rank | Wage/Income Gap |
| Nicaraguans | 99.6 /100 | #90 | Exceptional 23.4% |
| Arapaho | 99.6 /100 | #91 | Exceptional 23.5% |
| Immigrants | Honduras | 99.5 /100 | #92 | Exceptional 23.5% |
| Immigrants | Cabo Verde | 99.5 /100 | #93 | Exceptional 23.6% |
| Hondurans | 99.5 /100 | #94 | Exceptional 23.6% |
| Cape Verdeans | 99.4 /100 | #95 | Exceptional 23.6% |
| Kiowa | 99.4 /100 | #96 | Exceptional 23.6% |
| Immigrants | Sudan | 99.4 /100 | #97 | Exceptional 23.6% |
| Immigrants | Latin America | 99.2 /100 | #98 | Exceptional 23.7% |
| Aleuts | 99.2 /100 | #99 | Exceptional 23.7% |
| Yakama | 99.2 /100 | #100 | Exceptional 23.7% |
| Japanese | 99.1 /100 | #101 | Exceptional 23.8% |
| Immigrants | Laos | 99.0 /100 | #102 | Exceptional 23.8% |
| Tsimshian | 98.9 /100 | #103 | Exceptional 23.9% |
| Tlingit-Haida | 98.7 /100 | #104 | Exceptional 24.0% |
Demographics Similar to Immigrants from Europe by Wage/Income Gap
In terms of wage/income gap, the demographic groups most similar to Immigrants from Europe are Creek (27.1%, a difference of 0.020%), Immigrants from Sri Lanka (27.1%, a difference of 0.070%), Spanish (27.1%, a difference of 0.080%), Chickasaw (27.2%, a difference of 0.15%), and Immigrants from the Azores (27.2%, a difference of 0.16%).
| Demographics | Rating | Rank | Wage/Income Gap |
| Immigrants | Brazil | 5.0 /100 | #233 | Tragic 27.0% |
| Immigrants | Pakistan | 4.9 /100 | #234 | Tragic 27.0% |
| Immigrants | Hungary | 4.8 /100 | #235 | Tragic 27.0% |
| Immigrants | Romania | 4.8 /100 | #236 | Tragic 27.0% |
| Immigrants | Eastern Asia | 4.4 /100 | #237 | Tragic 27.1% |
| Osage | 4.4 /100 | #238 | Tragic 27.1% |
| Estonians | 4.3 /100 | #239 | Tragic 27.1% |
| Immigrants | Europe | 3.8 /100 | #240 | Tragic 27.1% |
| Creek | 3.8 /100 | #241 | Tragic 27.1% |
| Immigrants | Sri Lanka | 3.7 /100 | #242 | Tragic 27.1% |
| Spanish | 3.6 /100 | #243 | Tragic 27.1% |
| Chickasaw | 3.5 /100 | #244 | Tragic 27.2% |
| Immigrants | Azores | 3.5 /100 | #245 | Tragic 27.2% |
| Immigrants | Nonimmigrants | 3.3 /100 | #246 | Tragic 27.2% |
| Celtics | 2.8 /100 | #247 | Tragic 27.3% |