Immigrants from Sudan vs Swedish Wage/Income Gap
COMPARE
Immigrants from Sudan
Swedish
Wage/Income Gap
Wage/Income Gap Comparison
Immigrants from Sudan
Swedes
23.6%
WAGE/INCOME GAP
99.4/ 100
METRIC RATING
97th/ 347
METRIC RANK
29.4%
WAGE/INCOME GAP
0.0/ 100
METRIC RATING
334th/ 347
METRIC RANK
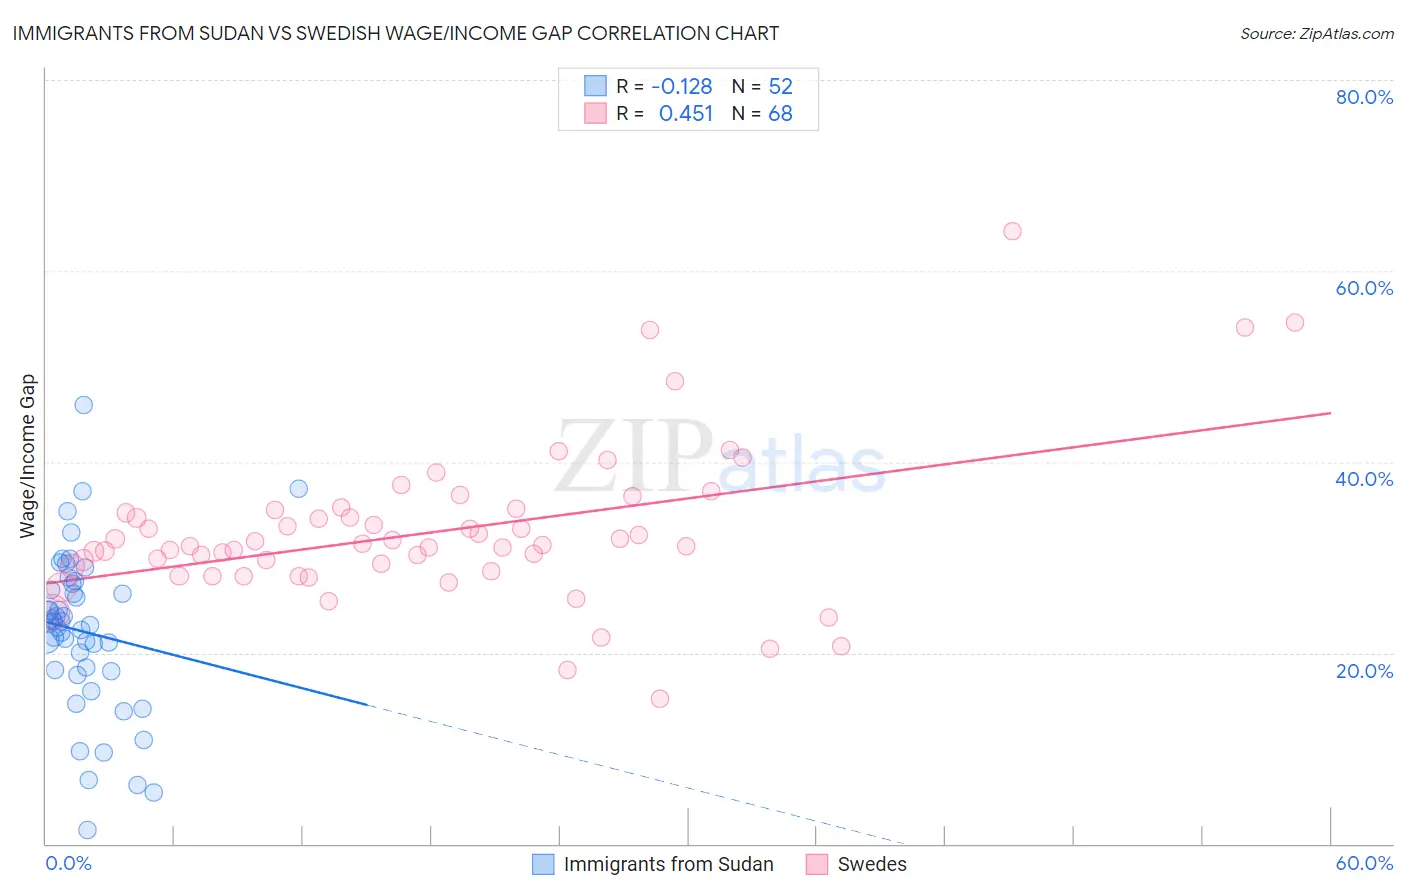
Immigrants from Sudan vs Swedish Wage/Income Gap Correlation Chart
The statistical analysis conducted on geographies consisting of 118,934,661 people shows a poor negative correlation between the proportion of Immigrants from Sudan and wage/income gap percentage in the United States with a correlation coefficient (R) of -0.128 and weighted average of 23.6%. Similarly, the statistical analysis conducted on geographies consisting of 537,447,925 people shows a moderate positive correlation between the proportion of Swedes and wage/income gap percentage in the United States with a correlation coefficient (R) of 0.451 and weighted average of 29.4%, a difference of 24.5%.
Wage/Income Gap Correlation Summary
| Measurement | Immigrants from Sudan | Swedish |
| Minimum | 1.4% | 15.2% |
| Maximum | 46.0% | 64.2% |
| Range | 44.6% | 49.0% |
| Mean | 22.2% | 32.7% |
| Median | 23.0% | 31.2% |
| Interquartile 25% (IQ1) | 18.1% | 28.8% |
| Interquartile 75% (IQ3) | 26.9% | 34.8% |
| Interquartile Range (IQR) | 8.8% | 6.1% |
| Standard Deviation (Sample) | 8.5% | 8.2% |
| Standard Deviation (Population) | 8.4% | 8.1% |
Similar Demographics by Wage/Income Gap
Demographics Similar to Immigrants from Sudan by Wage/Income Gap
In terms of wage/income gap, the demographic groups most similar to Immigrants from Sudan are Kiowa (23.6%, a difference of 0.090%), Cape Verdean (23.6%, a difference of 0.21%), Honduran (23.6%, a difference of 0.24%), Immigrants from Cabo Verde (23.6%, a difference of 0.33%), and Immigrants from Latin America (23.7%, a difference of 0.40%).
| Demographics | Rating | Rank | Wage/Income Gap |
| Nicaraguans | 99.6 /100 | #90 | Exceptional 23.4% |
| Arapaho | 99.6 /100 | #91 | Exceptional 23.5% |
| Immigrants | Honduras | 99.5 /100 | #92 | Exceptional 23.5% |
| Immigrants | Cabo Verde | 99.5 /100 | #93 | Exceptional 23.6% |
| Hondurans | 99.5 /100 | #94 | Exceptional 23.6% |
| Cape Verdeans | 99.4 /100 | #95 | Exceptional 23.6% |
| Kiowa | 99.4 /100 | #96 | Exceptional 23.6% |
| Immigrants | Sudan | 99.4 /100 | #97 | Exceptional 23.6% |
| Immigrants | Latin America | 99.2 /100 | #98 | Exceptional 23.7% |
| Aleuts | 99.2 /100 | #99 | Exceptional 23.7% |
| Yakama | 99.2 /100 | #100 | Exceptional 23.7% |
| Japanese | 99.1 /100 | #101 | Exceptional 23.8% |
| Immigrants | Laos | 99.0 /100 | #102 | Exceptional 23.8% |
| Tsimshian | 98.9 /100 | #103 | Exceptional 23.9% |
| Tlingit-Haida | 98.7 /100 | #104 | Exceptional 24.0% |
Demographics Similar to Swedes by Wage/Income Gap
In terms of wage/income gap, the demographic groups most similar to Swedes are Immigrants from Taiwan (29.5%, a difference of 0.13%), European (29.4%, a difference of 0.14%), English (29.5%, a difference of 0.14%), Immigrants from South Central Asia (29.3%, a difference of 0.34%), and Dutch (29.6%, a difference of 0.72%).
| Demographics | Rating | Rank | Wage/Income Gap |
| Immigrants | Iran | 0.0 /100 | #327 | Tragic 29.1% |
| Scandinavians | 0.0 /100 | #328 | Tragic 29.1% |
| Scottish | 0.0 /100 | #329 | Tragic 29.1% |
| Germans | 0.0 /100 | #330 | Tragic 29.2% |
| Czechs | 0.0 /100 | #331 | Tragic 29.2% |
| Immigrants | South Central Asia | 0.0 /100 | #332 | Tragic 29.3% |
| Europeans | 0.0 /100 | #333 | Tragic 29.4% |
| Swedes | 0.0 /100 | #334 | Tragic 29.4% |
| Immigrants | Taiwan | 0.0 /100 | #335 | Tragic 29.5% |
| English | 0.0 /100 | #336 | Tragic 29.5% |
| Dutch | 0.0 /100 | #337 | Tragic 29.6% |
| Filipinos | 0.0 /100 | #338 | Tragic 29.7% |
| Iranians | 0.0 /100 | #339 | Tragic 29.7% |
| Swiss | 0.0 /100 | #340 | Tragic 30.0% |
| Thais | 0.0 /100 | #341 | Tragic 30.5% |