Immigrants from Panama vs Immigrants from Hong Kong 9th Grade
COMPARE
Immigrants from Panama
Immigrants from Hong Kong
9th Grade
9th Grade Comparison
Immigrants from Panama
Immigrants from Hong Kong
94.3%
9TH GRADE
4.0/ 100
METRIC RATING
231st/ 347
METRIC RANK
94.1%
9TH GRADE
1.3/ 100
METRIC RATING
250th/ 347
METRIC RANK
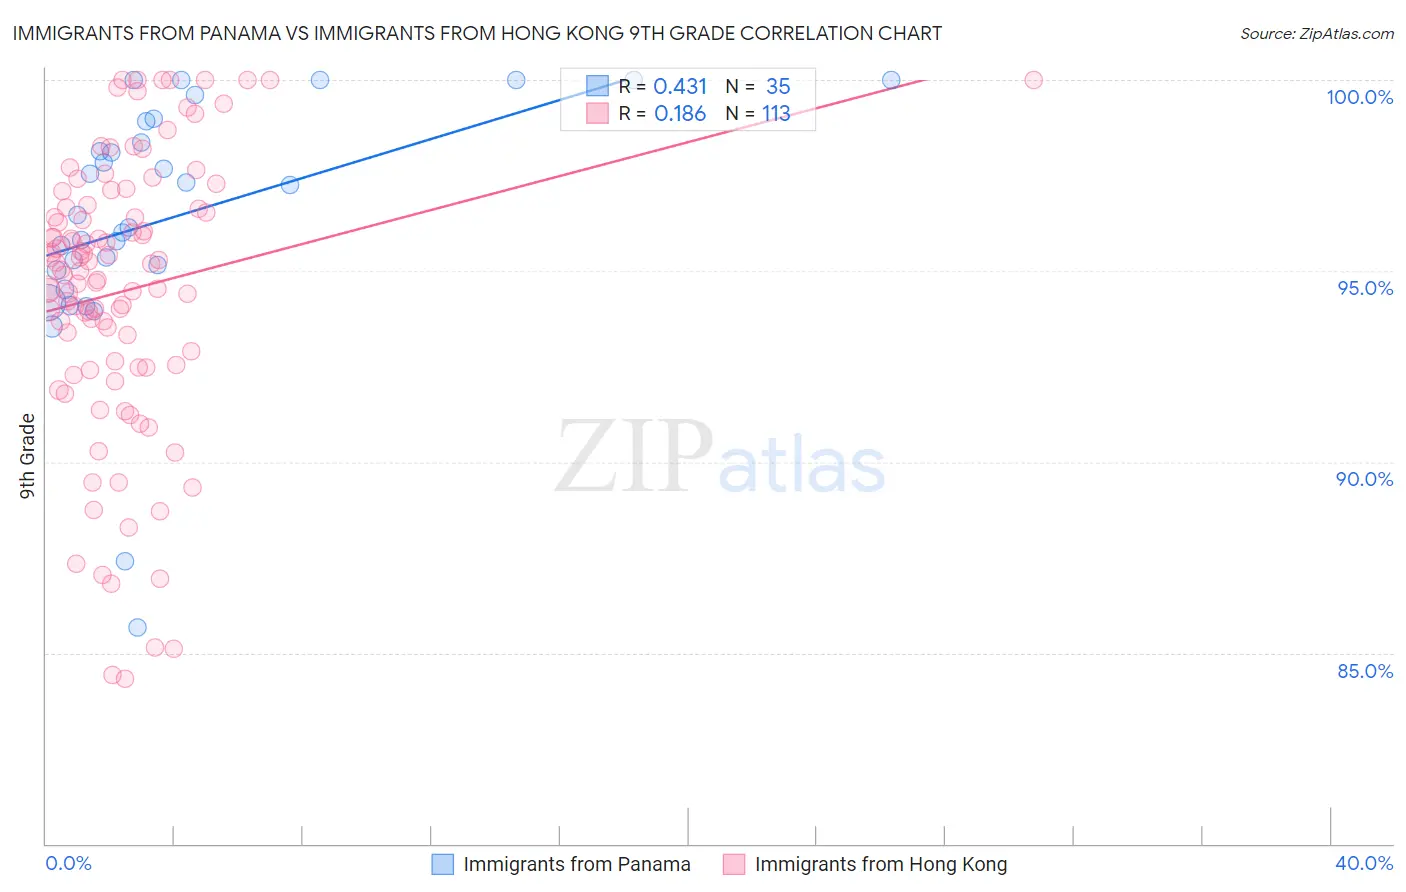
Immigrants from Panama vs Immigrants from Hong Kong 9th Grade Correlation Chart
The statistical analysis conducted on geographies consisting of 221,183,192 people shows a moderate positive correlation between the proportion of Immigrants from Panama and percentage of population with at least 9th grade education in the United States with a correlation coefficient (R) of 0.431 and weighted average of 94.3%. Similarly, the statistical analysis conducted on geographies consisting of 253,990,382 people shows a poor positive correlation between the proportion of Immigrants from Hong Kong and percentage of population with at least 9th grade education in the United States with a correlation coefficient (R) of 0.186 and weighted average of 94.1%, a difference of 0.21%.
9th Grade Correlation Summary
| Measurement | Immigrants from Panama | Immigrants from Hong Kong |
| Minimum | 85.7% | 84.3% |
| Maximum | 100.0% | 100.0% |
| Range | 14.3% | 15.7% |
| Mean | 96.4% | 94.5% |
| Median | 96.5% | 95.0% |
| Interquartile 25% (IQ1) | 95.0% | 92.5% |
| Interquartile 75% (IQ3) | 98.9% | 96.7% |
| Interquartile Range (IQR) | 3.9% | 4.2% |
| Standard Deviation (Sample) | 3.2% | 3.7% |
| Standard Deviation (Population) | 3.2% | 3.7% |
Demographics Similar to Immigrants from Panama and Immigrants from Hong Kong by 9th Grade
In terms of 9th grade, the demographic groups most similar to Immigrants from Panama are Apache (94.3%, a difference of 0.010%), Immigrants from Africa (94.3%, a difference of 0.010%), Nigerian (94.3%, a difference of 0.020%), Costa Rican (94.3%, a difference of 0.020%), and Bolivian (94.3%, a difference of 0.040%). Similarly, the demographic groups most similar to Immigrants from Hong Kong are Uruguayan (94.1%, a difference of 0.0%), Immigrants from Somalia (94.1%, a difference of 0.010%), Afghan (94.2%, a difference of 0.060%), Paiute (94.2%, a difference of 0.070%), and Senegalese (94.2%, a difference of 0.070%).
| Demographics | Rating | Rank | 9th Grade |
| Apache | 4.2 /100 | #230 | Tragic 94.3% |
| Immigrants | Panama | 4.0 /100 | #231 | Tragic 94.3% |
| Immigrants | Africa | 3.9 /100 | #232 | Tragic 94.3% |
| Nigerians | 3.7 /100 | #233 | Tragic 94.3% |
| Costa Ricans | 3.5 /100 | #234 | Tragic 94.3% |
| Bolivians | 3.3 /100 | #235 | Tragic 94.3% |
| Somalis | 2.9 /100 | #236 | Tragic 94.3% |
| Koreans | 2.9 /100 | #237 | Tragic 94.3% |
| South American Indians | 2.8 /100 | #238 | Tragic 94.3% |
| Immigrants | China | 2.8 /100 | #239 | Tragic 94.3% |
| Immigrants | Ethiopia | 2.7 /100 | #240 | Tragic 94.3% |
| Spanish Americans | 2.6 /100 | #241 | Tragic 94.2% |
| Immigrants | Middle Africa | 2.2 /100 | #242 | Tragic 94.2% |
| Immigrants | Cameroon | 2.1 /100 | #243 | Tragic 94.2% |
| Dutch West Indians | 2.0 /100 | #244 | Tragic 94.2% |
| Paiute | 1.9 /100 | #245 | Tragic 94.2% |
| Senegalese | 1.9 /100 | #246 | Tragic 94.2% |
| Afghans | 1.8 /100 | #247 | Tragic 94.2% |
| Immigrants | Somalia | 1.4 /100 | #248 | Tragic 94.1% |
| Uruguayans | 1.3 /100 | #249 | Tragic 94.1% |
| Immigrants | Hong Kong | 1.3 /100 | #250 | Tragic 94.1% |