Immigrants from Belarus vs Immigrants from Nepal Wage/Income Gap
COMPARE
Immigrants from Belarus
Immigrants from Nepal
Wage/Income Gap
Wage/Income Gap Comparison
Immigrants from Belarus
Immigrants from Nepal
25.7%
WAGE/INCOME GAP
52.9/ 100
METRIC RATING
173rd/ 347
METRIC RANK
24.9%
WAGE/INCOME GAP
89.3/ 100
METRIC RATING
140th/ 347
METRIC RANK
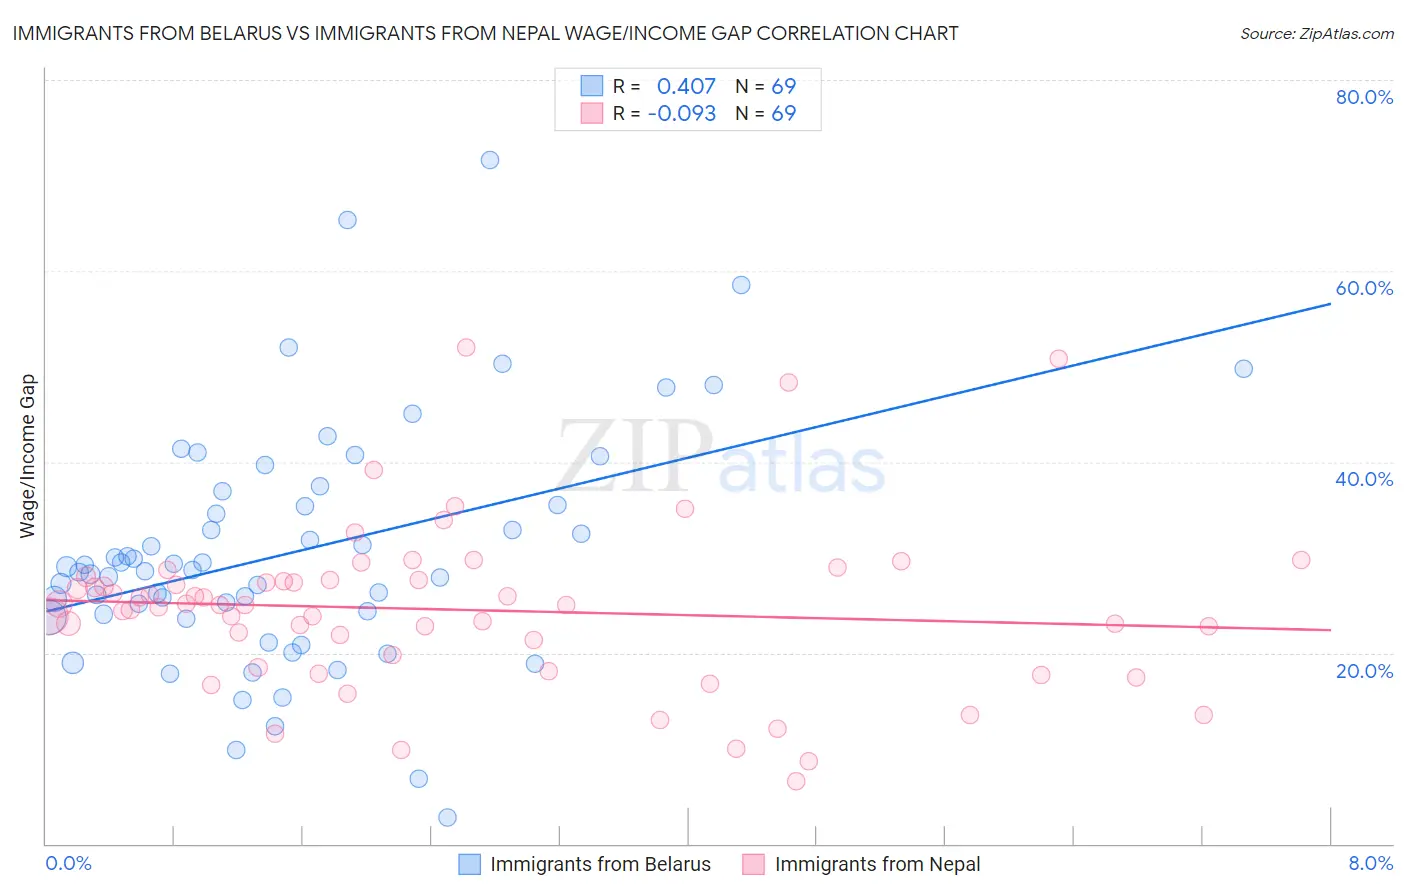
Immigrants from Belarus vs Immigrants from Nepal Wage/Income Gap Correlation Chart
The statistical analysis conducted on geographies consisting of 150,180,319 people shows a moderate positive correlation between the proportion of Immigrants from Belarus and wage/income gap percentage in the United States with a correlation coefficient (R) of 0.407 and weighted average of 25.7%. Similarly, the statistical analysis conducted on geographies consisting of 186,773,230 people shows a slight negative correlation between the proportion of Immigrants from Nepal and wage/income gap percentage in the United States with a correlation coefficient (R) of -0.093 and weighted average of 24.9%, a difference of 3.4%.
Wage/Income Gap Correlation Summary
| Measurement | Immigrants from Belarus | Immigrants from Nepal |
| Minimum | 2.8% | 6.5% |
| Maximum | 71.7% | 52.0% |
| Range | 68.9% | 45.5% |
| Mean | 30.5% | 24.5% |
| Median | 28.7% | 25.0% |
| Interquartile 25% (IQ1) | 23.9% | 19.1% |
| Interquartile 75% (IQ3) | 36.2% | 27.6% |
| Interquartile Range (IQR) | 12.3% | 8.5% |
| Standard Deviation (Sample) | 12.5% | 8.6% |
| Standard Deviation (Population) | 12.4% | 8.6% |
Similar Demographics by Wage/Income Gap
Demographics Similar to Immigrants from Belarus by Wage/Income Gap
In terms of wage/income gap, the demographic groups most similar to Immigrants from Belarus are Immigrants from Chile (25.7%, a difference of 0.020%), Alaskan Athabascan (25.8%, a difference of 0.19%), Immigrants from Greece (25.7%, a difference of 0.24%), Immigrants from Oceania (25.6%, a difference of 0.31%), and Sri Lankan (25.8%, a difference of 0.39%).
| Demographics | Rating | Rank | Wage/Income Gap |
| Immigrants | Ukraine | 63.8 /100 | #166 | Good 25.5% |
| Paiute | 62.9 /100 | #167 | Good 25.5% |
| Seminole | 62.6 /100 | #168 | Good 25.6% |
| Peruvians | 60.1 /100 | #169 | Good 25.6% |
| Immigrants | Oceania | 57.5 /100 | #170 | Average 25.6% |
| Immigrants | Greece | 56.6 /100 | #171 | Average 25.7% |
| Immigrants | Chile | 53.2 /100 | #172 | Average 25.7% |
| Immigrants | Belarus | 52.9 /100 | #173 | Average 25.7% |
| Alaskan Athabascans | 50.0 /100 | #174 | Average 25.8% |
| Sri Lankans | 47.0 /100 | #175 | Average 25.8% |
| Paraguayans | 46.7 /100 | #176 | Average 25.8% |
| Cambodians | 45.1 /100 | #177 | Average 25.8% |
| Chinese | 42.0 /100 | #178 | Average 25.9% |
| Samoans | 38.6 /100 | #179 | Fair 26.0% |
| Guamanians/Chamorros | 38.0 /100 | #180 | Fair 26.0% |
Demographics Similar to Immigrants from Nepal by Wage/Income Gap
In terms of wage/income gap, the demographic groups most similar to Immigrants from Nepal are Hawaiian (24.9%, a difference of 0.010%), Hispanic or Latino (24.9%, a difference of 0.030%), Immigrants from Bosnia and Herzegovina (24.8%, a difference of 0.14%), Afghan (24.9%, a difference of 0.21%), and Immigrants from Uganda (24.9%, a difference of 0.22%).
| Demographics | Rating | Rank | Wage/Income Gap |
| Colombians | 92.4 /100 | #133 | Exceptional 24.7% |
| Mexican American Indians | 92.2 /100 | #134 | Exceptional 24.7% |
| South American Indians | 92.0 /100 | #135 | Exceptional 24.7% |
| Armenians | 91.3 /100 | #136 | Exceptional 24.8% |
| Immigrants | South Eastern Asia | 90.9 /100 | #137 | Exceptional 24.8% |
| Immigrants | Bosnia and Herzegovina | 90.1 /100 | #138 | Exceptional 24.8% |
| Hispanics or Latinos | 89.5 /100 | #139 | Excellent 24.9% |
| Immigrants | Nepal | 89.3 /100 | #140 | Excellent 24.9% |
| Hawaiians | 89.3 /100 | #141 | Excellent 24.9% |
| Afghans | 88.1 /100 | #142 | Excellent 24.9% |
| Immigrants | Uganda | 88.0 /100 | #143 | Excellent 24.9% |
| Chippewa | 86.9 /100 | #144 | Excellent 25.0% |
| Comanche | 85.2 /100 | #145 | Excellent 25.0% |
| South Americans | 85.2 /100 | #146 | Excellent 25.0% |
| Malaysians | 84.9 /100 | #147 | Excellent 25.0% |