Tsimshian vs Immigrants from Nepal Wage/Income Gap
COMPARE
Tsimshian
Immigrants from Nepal
Wage/Income Gap
Wage/Income Gap Comparison
Tsimshian
Immigrants from Nepal
23.9%
WAGE/INCOME GAP
98.9/ 100
METRIC RATING
103rd/ 347
METRIC RANK
24.9%
WAGE/INCOME GAP
89.3/ 100
METRIC RATING
140th/ 347
METRIC RANK
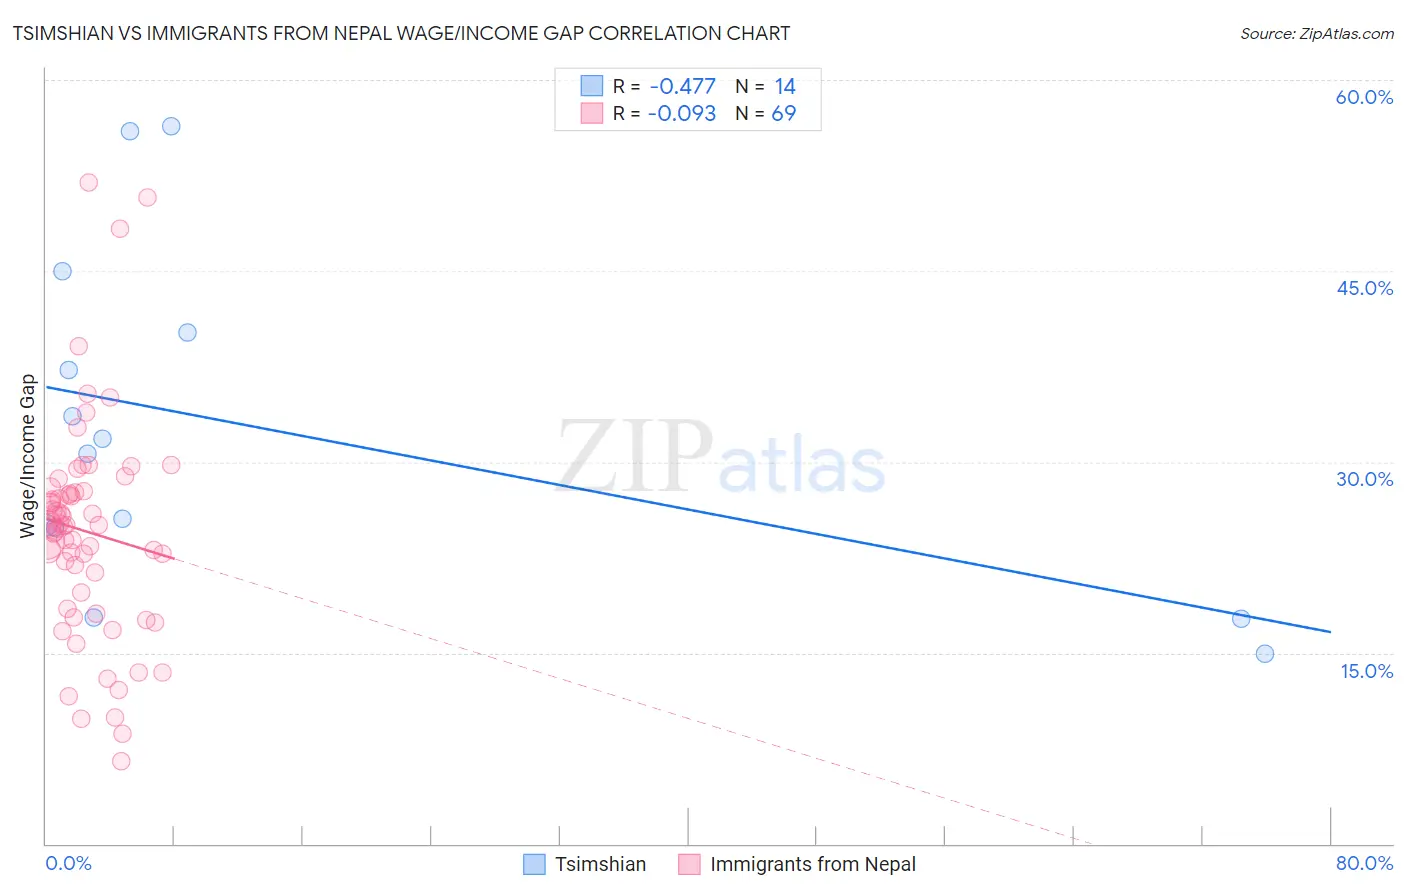
Tsimshian vs Immigrants from Nepal Wage/Income Gap Correlation Chart
The statistical analysis conducted on geographies consisting of 15,623,634 people shows a moderate negative correlation between the proportion of Tsimshian and wage/income gap percentage in the United States with a correlation coefficient (R) of -0.477 and weighted average of 23.9%. Similarly, the statistical analysis conducted on geographies consisting of 186,773,230 people shows a slight negative correlation between the proportion of Immigrants from Nepal and wage/income gap percentage in the United States with a correlation coefficient (R) of -0.093 and weighted average of 24.9%, a difference of 4.2%.
Wage/Income Gap Correlation Summary
| Measurement | Tsimshian | Immigrants from Nepal |
| Minimum | 14.9% | 6.5% |
| Maximum | 56.3% | 52.0% |
| Range | 41.4% | 45.5% |
| Mean | 32.6% | 24.5% |
| Median | 31.2% | 25.0% |
| Interquartile 25% (IQ1) | 24.9% | 19.1% |
| Interquartile 75% (IQ3) | 40.2% | 27.6% |
| Interquartile Range (IQR) | 15.3% | 8.5% |
| Standard Deviation (Sample) | 13.2% | 8.6% |
| Standard Deviation (Population) | 12.7% | 8.6% |
Similar Demographics by Wage/Income Gap
Demographics Similar to Tsimshian by Wage/Income Gap
In terms of wage/income gap, the demographic groups most similar to Tsimshian are Immigrants from Laos (23.8%, a difference of 0.23%), Tlingit-Haida (24.0%, a difference of 0.33%), Japanese (23.8%, a difference of 0.37%), Moroccan (24.0%, a difference of 0.39%), and Sudanese (24.0%, a difference of 0.39%).
| Demographics | Rating | Rank | Wage/Income Gap |
| Kiowa | 99.4 /100 | #96 | Exceptional 23.6% |
| Immigrants | Sudan | 99.4 /100 | #97 | Exceptional 23.6% |
| Immigrants | Latin America | 99.2 /100 | #98 | Exceptional 23.7% |
| Aleuts | 99.2 /100 | #99 | Exceptional 23.7% |
| Yakama | 99.2 /100 | #100 | Exceptional 23.7% |
| Japanese | 99.1 /100 | #101 | Exceptional 23.8% |
| Immigrants | Laos | 99.0 /100 | #102 | Exceptional 23.8% |
| Tsimshian | 98.9 /100 | #103 | Exceptional 23.9% |
| Tlingit-Haida | 98.7 /100 | #104 | Exceptional 24.0% |
| Moroccans | 98.6 /100 | #105 | Exceptional 24.0% |
| Sudanese | 98.6 /100 | #106 | Exceptional 24.0% |
| Yaqui | 98.4 /100 | #107 | Exceptional 24.0% |
| Immigrants | Albania | 98.4 /100 | #108 | Exceptional 24.0% |
| Ugandans | 98.3 /100 | #109 | Exceptional 24.1% |
| Immigrants | Morocco | 98.1 /100 | #110 | Exceptional 24.1% |
Demographics Similar to Immigrants from Nepal by Wage/Income Gap
In terms of wage/income gap, the demographic groups most similar to Immigrants from Nepal are Hawaiian (24.9%, a difference of 0.010%), Hispanic or Latino (24.9%, a difference of 0.030%), Immigrants from Bosnia and Herzegovina (24.8%, a difference of 0.14%), Afghan (24.9%, a difference of 0.21%), and Immigrants from Uganda (24.9%, a difference of 0.22%).
| Demographics | Rating | Rank | Wage/Income Gap |
| Colombians | 92.4 /100 | #133 | Exceptional 24.7% |
| Mexican American Indians | 92.2 /100 | #134 | Exceptional 24.7% |
| South American Indians | 92.0 /100 | #135 | Exceptional 24.7% |
| Armenians | 91.3 /100 | #136 | Exceptional 24.8% |
| Immigrants | South Eastern Asia | 90.9 /100 | #137 | Exceptional 24.8% |
| Immigrants | Bosnia and Herzegovina | 90.1 /100 | #138 | Exceptional 24.8% |
| Hispanics or Latinos | 89.5 /100 | #139 | Excellent 24.9% |
| Immigrants | Nepal | 89.3 /100 | #140 | Excellent 24.9% |
| Hawaiians | 89.3 /100 | #141 | Excellent 24.9% |
| Afghans | 88.1 /100 | #142 | Excellent 24.9% |
| Immigrants | Uganda | 88.0 /100 | #143 | Excellent 24.9% |
| Chippewa | 86.9 /100 | #144 | Excellent 25.0% |
| Comanche | 85.2 /100 | #145 | Excellent 25.0% |
| South Americans | 85.2 /100 | #146 | Excellent 25.0% |
| Malaysians | 84.9 /100 | #147 | Excellent 25.0% |