European vs Immigrants from Nepal Wage/Income Gap
COMPARE
European
Immigrants from Nepal
Wage/Income Gap
Wage/Income Gap Comparison
Europeans
Immigrants from Nepal
29.4%
WAGE/INCOME GAP
0.0/ 100
METRIC RATING
333rd/ 347
METRIC RANK
24.9%
WAGE/INCOME GAP
89.3/ 100
METRIC RATING
140th/ 347
METRIC RANK
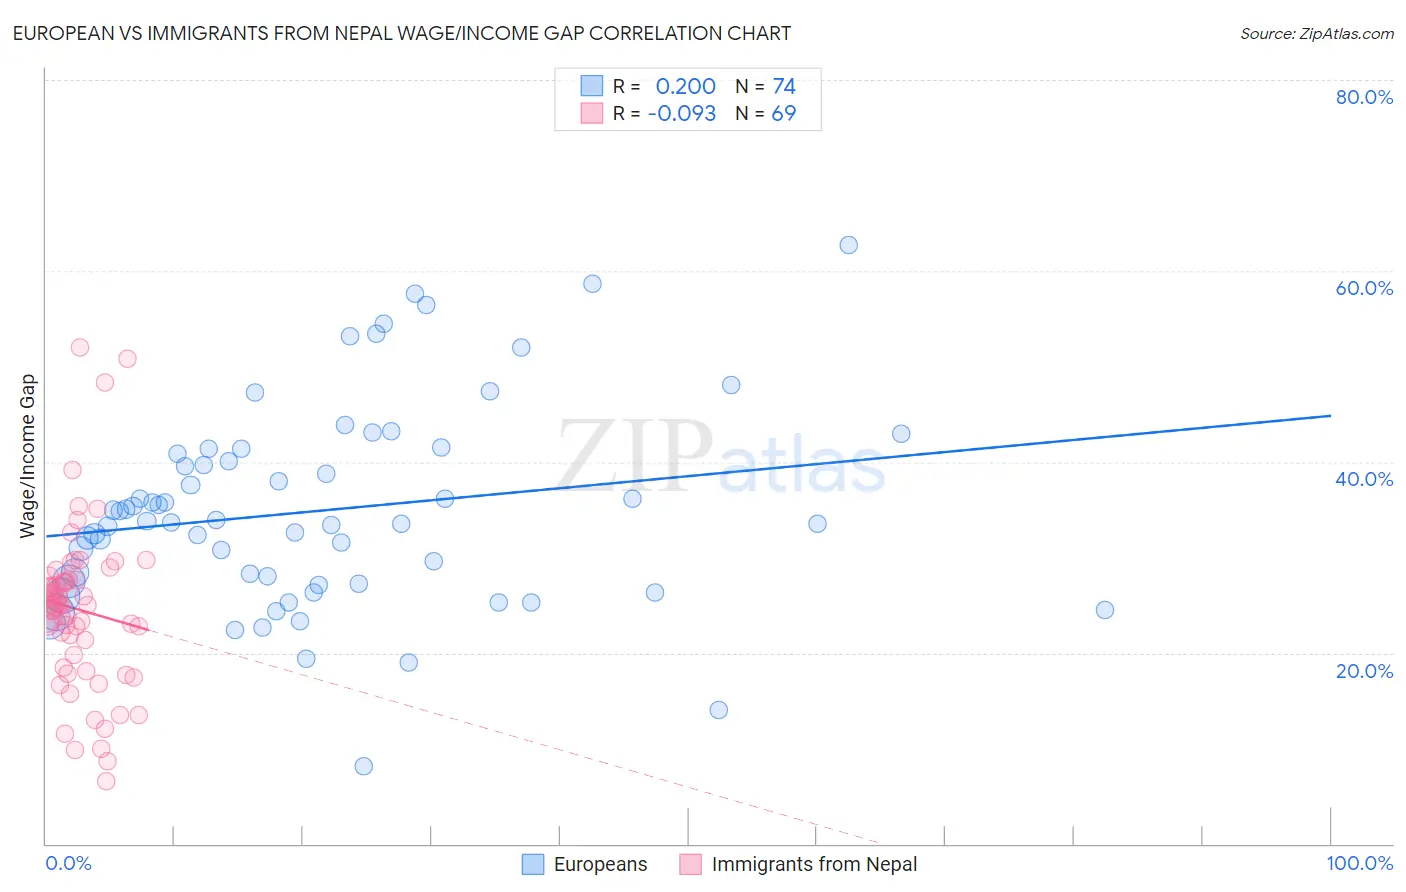
European vs Immigrants from Nepal Wage/Income Gap Correlation Chart
The statistical analysis conducted on geographies consisting of 559,619,805 people shows a weak positive correlation between the proportion of Europeans and wage/income gap percentage in the United States with a correlation coefficient (R) of 0.200 and weighted average of 29.4%. Similarly, the statistical analysis conducted on geographies consisting of 186,773,230 people shows a slight negative correlation between the proportion of Immigrants from Nepal and wage/income gap percentage in the United States with a correlation coefficient (R) of -0.093 and weighted average of 24.9%, a difference of 18.1%.
Wage/Income Gap Correlation Summary
| Measurement | European | Immigrants from Nepal |
| Minimum | 8.1% | 6.5% |
| Maximum | 62.8% | 52.0% |
| Range | 54.6% | 45.5% |
| Mean | 34.9% | 24.5% |
| Median | 33.8% | 25.0% |
| Interquartile 25% (IQ1) | 27.2% | 19.1% |
| Interquartile 75% (IQ3) | 40.8% | 27.6% |
| Interquartile Range (IQR) | 13.6% | 8.5% |
| Standard Deviation (Sample) | 10.6% | 8.6% |
| Standard Deviation (Population) | 10.5% | 8.6% |
Similar Demographics by Wage/Income Gap
Demographics Similar to Europeans by Wage/Income Gap
In terms of wage/income gap, the demographic groups most similar to Europeans are Swedish (29.4%, a difference of 0.14%), Immigrants from South Central Asia (29.3%, a difference of 0.19%), Immigrants from Taiwan (29.5%, a difference of 0.27%), English (29.5%, a difference of 0.28%), and Czech (29.2%, a difference of 0.70%).
| Demographics | Rating | Rank | Wage/Income Gap |
| Immigrants | Belgium | 0.0 /100 | #326 | Tragic 29.0% |
| Immigrants | Iran | 0.0 /100 | #327 | Tragic 29.1% |
| Scandinavians | 0.0 /100 | #328 | Tragic 29.1% |
| Scottish | 0.0 /100 | #329 | Tragic 29.1% |
| Germans | 0.0 /100 | #330 | Tragic 29.2% |
| Czechs | 0.0 /100 | #331 | Tragic 29.2% |
| Immigrants | South Central Asia | 0.0 /100 | #332 | Tragic 29.3% |
| Europeans | 0.0 /100 | #333 | Tragic 29.4% |
| Swedes | 0.0 /100 | #334 | Tragic 29.4% |
| Immigrants | Taiwan | 0.0 /100 | #335 | Tragic 29.5% |
| English | 0.0 /100 | #336 | Tragic 29.5% |
| Dutch | 0.0 /100 | #337 | Tragic 29.6% |
| Filipinos | 0.0 /100 | #338 | Tragic 29.7% |
| Iranians | 0.0 /100 | #339 | Tragic 29.7% |
| Swiss | 0.0 /100 | #340 | Tragic 30.0% |
Demographics Similar to Immigrants from Nepal by Wage/Income Gap
In terms of wage/income gap, the demographic groups most similar to Immigrants from Nepal are Hawaiian (24.9%, a difference of 0.010%), Hispanic or Latino (24.9%, a difference of 0.030%), Immigrants from Bosnia and Herzegovina (24.8%, a difference of 0.14%), Afghan (24.9%, a difference of 0.21%), and Immigrants from Uganda (24.9%, a difference of 0.22%).
| Demographics | Rating | Rank | Wage/Income Gap |
| Colombians | 92.4 /100 | #133 | Exceptional 24.7% |
| Mexican American Indians | 92.2 /100 | #134 | Exceptional 24.7% |
| South American Indians | 92.0 /100 | #135 | Exceptional 24.7% |
| Armenians | 91.3 /100 | #136 | Exceptional 24.8% |
| Immigrants | South Eastern Asia | 90.9 /100 | #137 | Exceptional 24.8% |
| Immigrants | Bosnia and Herzegovina | 90.1 /100 | #138 | Exceptional 24.8% |
| Hispanics or Latinos | 89.5 /100 | #139 | Excellent 24.9% |
| Immigrants | Nepal | 89.3 /100 | #140 | Excellent 24.9% |
| Hawaiians | 89.3 /100 | #141 | Excellent 24.9% |
| Afghans | 88.1 /100 | #142 | Excellent 24.9% |
| Immigrants | Uganda | 88.0 /100 | #143 | Excellent 24.9% |
| Chippewa | 86.9 /100 | #144 | Excellent 25.0% |
| Comanche | 85.2 /100 | #145 | Excellent 25.0% |
| South Americans | 85.2 /100 | #146 | Excellent 25.0% |
| Malaysians | 84.9 /100 | #147 | Excellent 25.0% |