Immigrants from Belarus vs Spanish American Indian Wage/Income Gap
COMPARE
Immigrants from Belarus
Spanish American Indian
Wage/Income Gap
Wage/Income Gap Comparison
Immigrants from Belarus
Spanish American Indians
25.7%
WAGE/INCOME GAP
52.9/ 100
METRIC RATING
173rd/ 347
METRIC RANK
22.5%
WAGE/INCOME GAP
100.0/ 100
METRIC RATING
64th/ 347
METRIC RANK
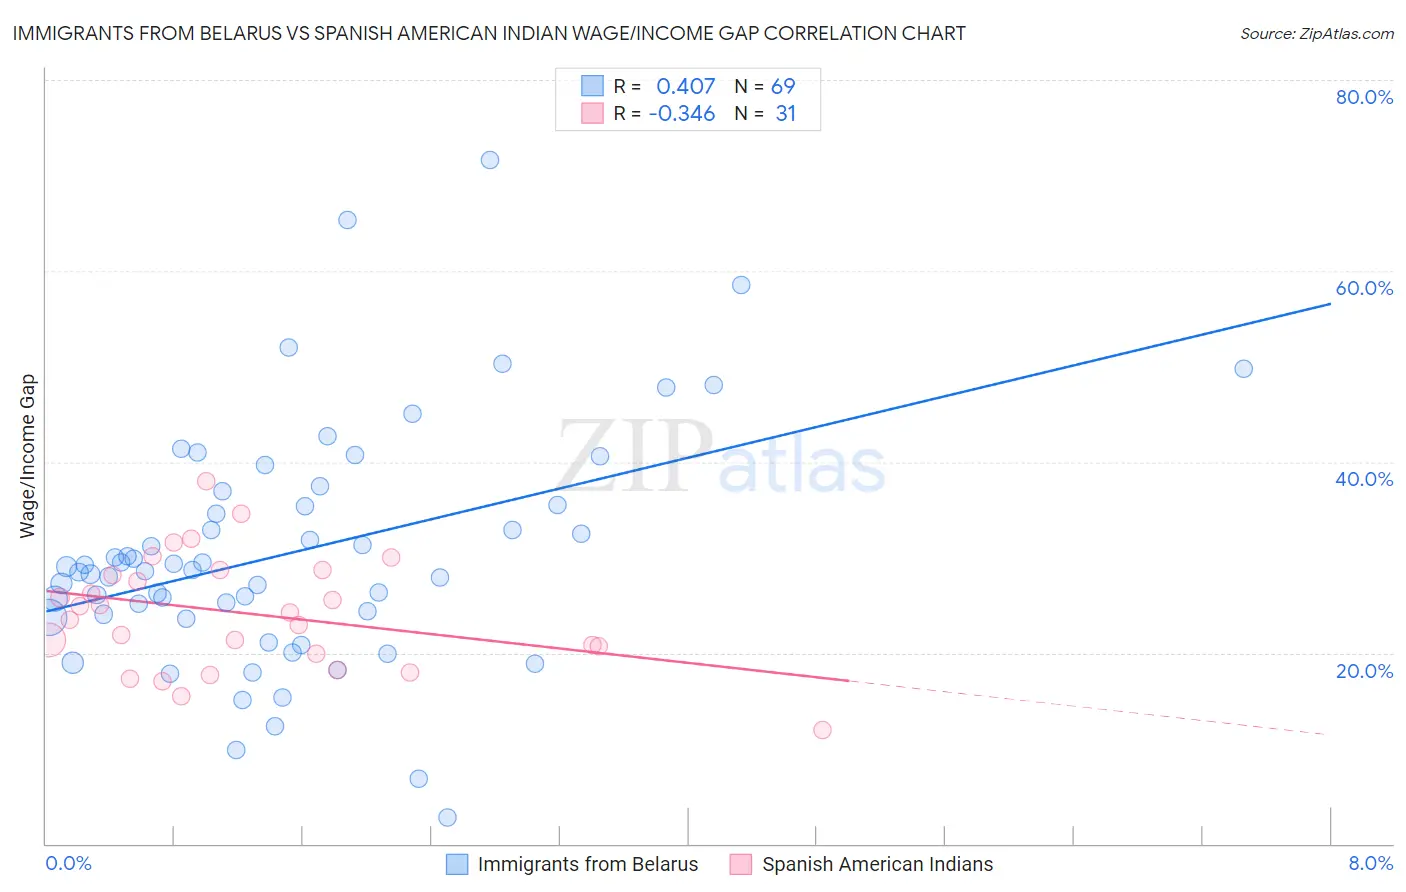
Immigrants from Belarus vs Spanish American Indian Wage/Income Gap Correlation Chart
The statistical analysis conducted on geographies consisting of 150,180,319 people shows a moderate positive correlation between the proportion of Immigrants from Belarus and wage/income gap percentage in the United States with a correlation coefficient (R) of 0.407 and weighted average of 25.7%. Similarly, the statistical analysis conducted on geographies consisting of 73,143,386 people shows a mild negative correlation between the proportion of Spanish American Indians and wage/income gap percentage in the United States with a correlation coefficient (R) of -0.346 and weighted average of 22.5%, a difference of 14.1%.
Wage/Income Gap Correlation Summary
| Measurement | Immigrants from Belarus | Spanish American Indian |
| Minimum | 2.8% | 11.9% |
| Maximum | 71.7% | 37.9% |
| Range | 68.9% | 26.0% |
| Mean | 30.5% | 24.1% |
| Median | 28.7% | 24.3% |
| Interquartile 25% (IQ1) | 23.9% | 19.9% |
| Interquartile 75% (IQ3) | 36.2% | 28.6% |
| Interquartile Range (IQR) | 12.3% | 8.8% |
| Standard Deviation (Sample) | 12.5% | 6.0% |
| Standard Deviation (Population) | 12.4% | 5.9% |
Similar Demographics by Wage/Income Gap
Demographics Similar to Immigrants from Belarus by Wage/Income Gap
In terms of wage/income gap, the demographic groups most similar to Immigrants from Belarus are Immigrants from Chile (25.7%, a difference of 0.020%), Alaskan Athabascan (25.8%, a difference of 0.19%), Immigrants from Greece (25.7%, a difference of 0.24%), Immigrants from Oceania (25.6%, a difference of 0.31%), and Sri Lankan (25.8%, a difference of 0.39%).
| Demographics | Rating | Rank | Wage/Income Gap |
| Immigrants | Ukraine | 63.8 /100 | #166 | Good 25.5% |
| Paiute | 62.9 /100 | #167 | Good 25.5% |
| Seminole | 62.6 /100 | #168 | Good 25.6% |
| Peruvians | 60.1 /100 | #169 | Good 25.6% |
| Immigrants | Oceania | 57.5 /100 | #170 | Average 25.6% |
| Immigrants | Greece | 56.6 /100 | #171 | Average 25.7% |
| Immigrants | Chile | 53.2 /100 | #172 | Average 25.7% |
| Immigrants | Belarus | 52.9 /100 | #173 | Average 25.7% |
| Alaskan Athabascans | 50.0 /100 | #174 | Average 25.8% |
| Sri Lankans | 47.0 /100 | #175 | Average 25.8% |
| Paraguayans | 46.7 /100 | #176 | Average 25.8% |
| Cambodians | 45.1 /100 | #177 | Average 25.8% |
| Chinese | 42.0 /100 | #178 | Average 25.9% |
| Samoans | 38.6 /100 | #179 | Fair 26.0% |
| Guamanians/Chamorros | 38.0 /100 | #180 | Fair 26.0% |
Demographics Similar to Spanish American Indians by Wage/Income Gap
In terms of wage/income gap, the demographic groups most similar to Spanish American Indians are Immigrants from Ecuador (22.5%, a difference of 0.29%), Guatemalan (22.6%, a difference of 0.32%), Immigrants from Guatemala (22.5%, a difference of 0.43%), Central American Indian (22.7%, a difference of 0.56%), and Immigrants from Fiji (22.4%, a difference of 0.64%).
| Demographics | Rating | Rank | Wage/Income Gap |
| Ghanaians | 100.0 /100 | #57 | Exceptional 22.3% |
| Immigrants | Cuba | 100.0 /100 | #58 | Exceptional 22.4% |
| Navajo | 100.0 /100 | #59 | Exceptional 22.4% |
| Immigrants | Middle Africa | 100.0 /100 | #60 | Exceptional 22.4% |
| Immigrants | Fiji | 100.0 /100 | #61 | Exceptional 22.4% |
| Immigrants | Guatemala | 100.0 /100 | #62 | Exceptional 22.5% |
| Immigrants | Ecuador | 100.0 /100 | #63 | Exceptional 22.5% |
| Spanish American Indians | 100.0 /100 | #64 | Exceptional 22.5% |
| Guatemalans | 99.9 /100 | #65 | Exceptional 22.6% |
| Central American Indians | 99.9 /100 | #66 | Exceptional 22.7% |
| Menominee | 99.9 /100 | #67 | Exceptional 22.7% |
| Immigrants | Nigeria | 99.9 /100 | #68 | Exceptional 22.7% |
| Indonesians | 99.9 /100 | #69 | Exceptional 22.7% |
| Immigrants | Uzbekistan | 99.9 /100 | #70 | Exceptional 22.7% |
| Immigrants | El Salvador | 99.9 /100 | #71 | Exceptional 22.8% |