Immigrants from Belarus vs Cree Wage/Income Gap
COMPARE
Immigrants from Belarus
Cree
Wage/Income Gap
Wage/Income Gap Comparison
Immigrants from Belarus
Cree
25.7%
WAGE/INCOME GAP
52.9/ 100
METRIC RATING
173rd/ 347
METRIC RANK
24.5%
WAGE/INCOME GAP
95.6/ 100
METRIC RATING
120th/ 347
METRIC RANK
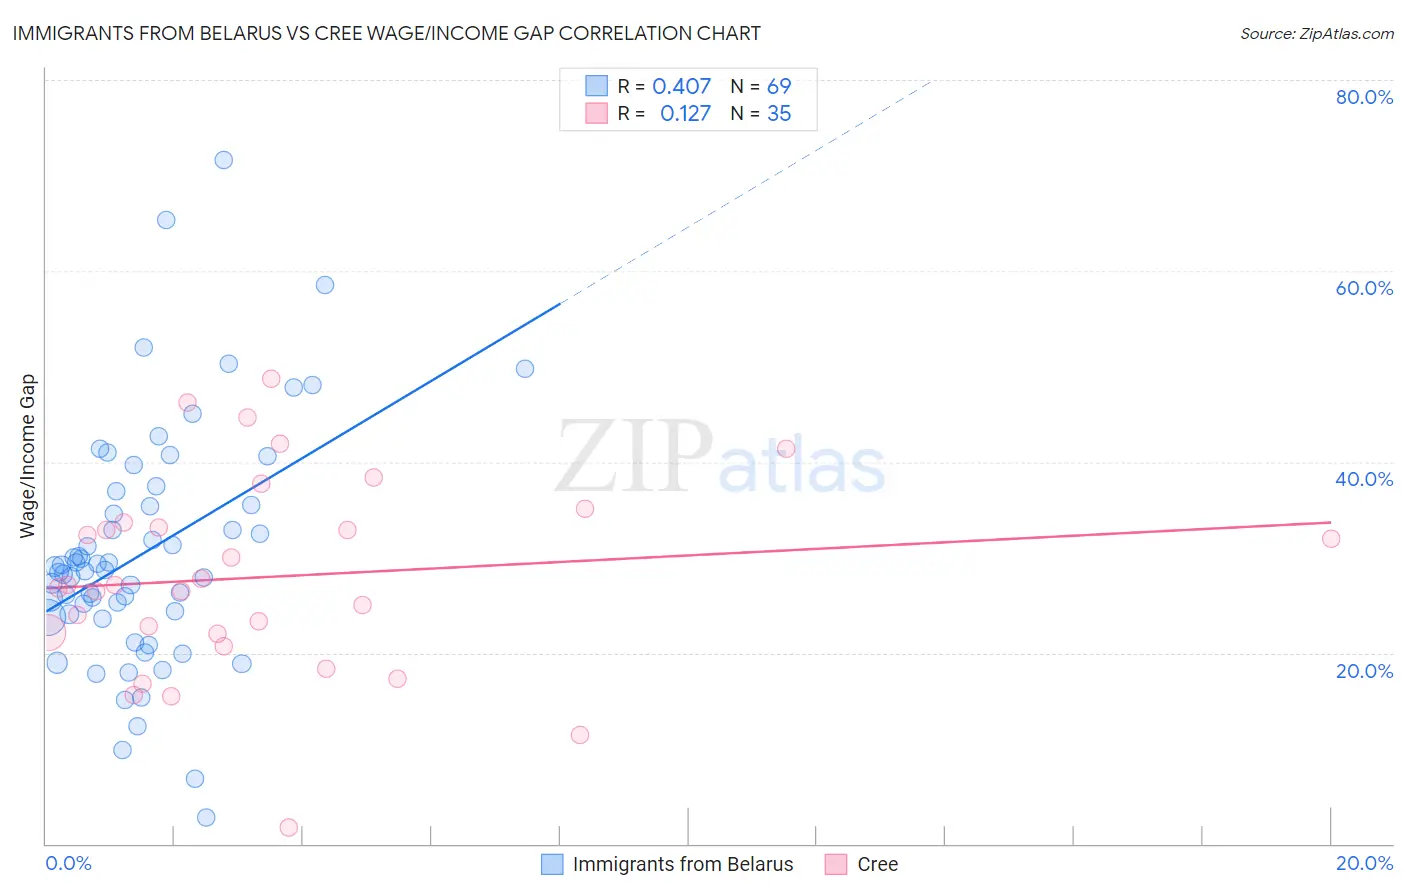
Immigrants from Belarus vs Cree Wage/Income Gap Correlation Chart
The statistical analysis conducted on geographies consisting of 150,180,319 people shows a moderate positive correlation between the proportion of Immigrants from Belarus and wage/income gap percentage in the United States with a correlation coefficient (R) of 0.407 and weighted average of 25.7%. Similarly, the statistical analysis conducted on geographies consisting of 76,178,665 people shows a poor positive correlation between the proportion of Cree and wage/income gap percentage in the United States with a correlation coefficient (R) of 0.127 and weighted average of 24.5%, a difference of 5.1%.
Wage/Income Gap Correlation Summary
| Measurement | Immigrants from Belarus | Cree |
| Minimum | 2.8% | 1.7% |
| Maximum | 71.7% | 48.7% |
| Range | 68.9% | 47.0% |
| Mean | 30.5% | 28.0% |
| Median | 28.7% | 27.1% |
| Interquartile 25% (IQ1) | 23.9% | 21.9% |
| Interquartile 75% (IQ3) | 36.2% | 33.6% |
| Interquartile Range (IQR) | 12.3% | 11.7% |
| Standard Deviation (Sample) | 12.5% | 10.3% |
| Standard Deviation (Population) | 12.4% | 10.2% |
Similar Demographics by Wage/Income Gap
Demographics Similar to Immigrants from Belarus by Wage/Income Gap
In terms of wage/income gap, the demographic groups most similar to Immigrants from Belarus are Immigrants from Chile (25.7%, a difference of 0.020%), Alaskan Athabascan (25.8%, a difference of 0.19%), Immigrants from Greece (25.7%, a difference of 0.24%), Immigrants from Oceania (25.6%, a difference of 0.31%), and Sri Lankan (25.8%, a difference of 0.39%).
| Demographics | Rating | Rank | Wage/Income Gap |
| Immigrants | Ukraine | 63.8 /100 | #166 | Good 25.5% |
| Paiute | 62.9 /100 | #167 | Good 25.5% |
| Seminole | 62.6 /100 | #168 | Good 25.6% |
| Peruvians | 60.1 /100 | #169 | Good 25.6% |
| Immigrants | Oceania | 57.5 /100 | #170 | Average 25.6% |
| Immigrants | Greece | 56.6 /100 | #171 | Average 25.7% |
| Immigrants | Chile | 53.2 /100 | #172 | Average 25.7% |
| Immigrants | Belarus | 52.9 /100 | #173 | Average 25.7% |
| Alaskan Athabascans | 50.0 /100 | #174 | Average 25.8% |
| Sri Lankans | 47.0 /100 | #175 | Average 25.8% |
| Paraguayans | 46.7 /100 | #176 | Average 25.8% |
| Cambodians | 45.1 /100 | #177 | Average 25.8% |
| Chinese | 42.0 /100 | #178 | Average 25.9% |
| Samoans | 38.6 /100 | #179 | Fair 26.0% |
| Guamanians/Chamorros | 38.0 /100 | #180 | Fair 26.0% |
Demographics Similar to Cree by Wage/Income Gap
In terms of wage/income gap, the demographic groups most similar to Cree are Kenyan (24.5%, a difference of 0.070%), Immigrants from Micronesia (24.4%, a difference of 0.090%), Immigrants from Afghanistan (24.4%, a difference of 0.13%), Alaska Native (24.4%, a difference of 0.19%), and Immigrants from Thailand (24.5%, a difference of 0.27%).
| Demographics | Rating | Rank | Wage/Income Gap |
| Sioux | 96.9 /100 | #113 | Exceptional 24.3% |
| Panamanians | 96.5 /100 | #114 | Exceptional 24.4% |
| Immigrants | Kenya | 96.4 /100 | #115 | Exceptional 24.4% |
| Alaska Natives | 96.0 /100 | #116 | Exceptional 24.4% |
| Immigrants | Afghanistan | 95.9 /100 | #117 | Exceptional 24.4% |
| Immigrants | Micronesia | 95.8 /100 | #118 | Exceptional 24.4% |
| Kenyans | 95.8 /100 | #119 | Exceptional 24.5% |
| Cree | 95.6 /100 | #120 | Exceptional 24.5% |
| Immigrants | Thailand | 94.9 /100 | #121 | Exceptional 24.5% |
| Apache | 94.8 /100 | #122 | Exceptional 24.5% |
| Natives/Alaskans | 94.6 /100 | #123 | Exceptional 24.6% |
| Immigrants | South America | 93.9 /100 | #124 | Exceptional 24.6% |
| Spanish Americans | 93.8 /100 | #125 | Exceptional 24.6% |
| Immigrants | Uruguay | 93.8 /100 | #126 | Exceptional 24.6% |
| German Russians | 93.7 /100 | #127 | Exceptional 24.6% |