Immigrants from Middle Africa vs Ukrainian Wage/Income Gap
COMPARE
Immigrants from Middle Africa
Ukrainian
Wage/Income Gap
Wage/Income Gap Comparison
Immigrants from Middle Africa
Ukrainians
22.4%
WAGE/INCOME GAP
100.0/ 100
METRIC RATING
60th/ 347
METRIC RANK
27.3%
WAGE/INCOME GAP
2.4/ 100
METRIC RATING
252nd/ 347
METRIC RANK
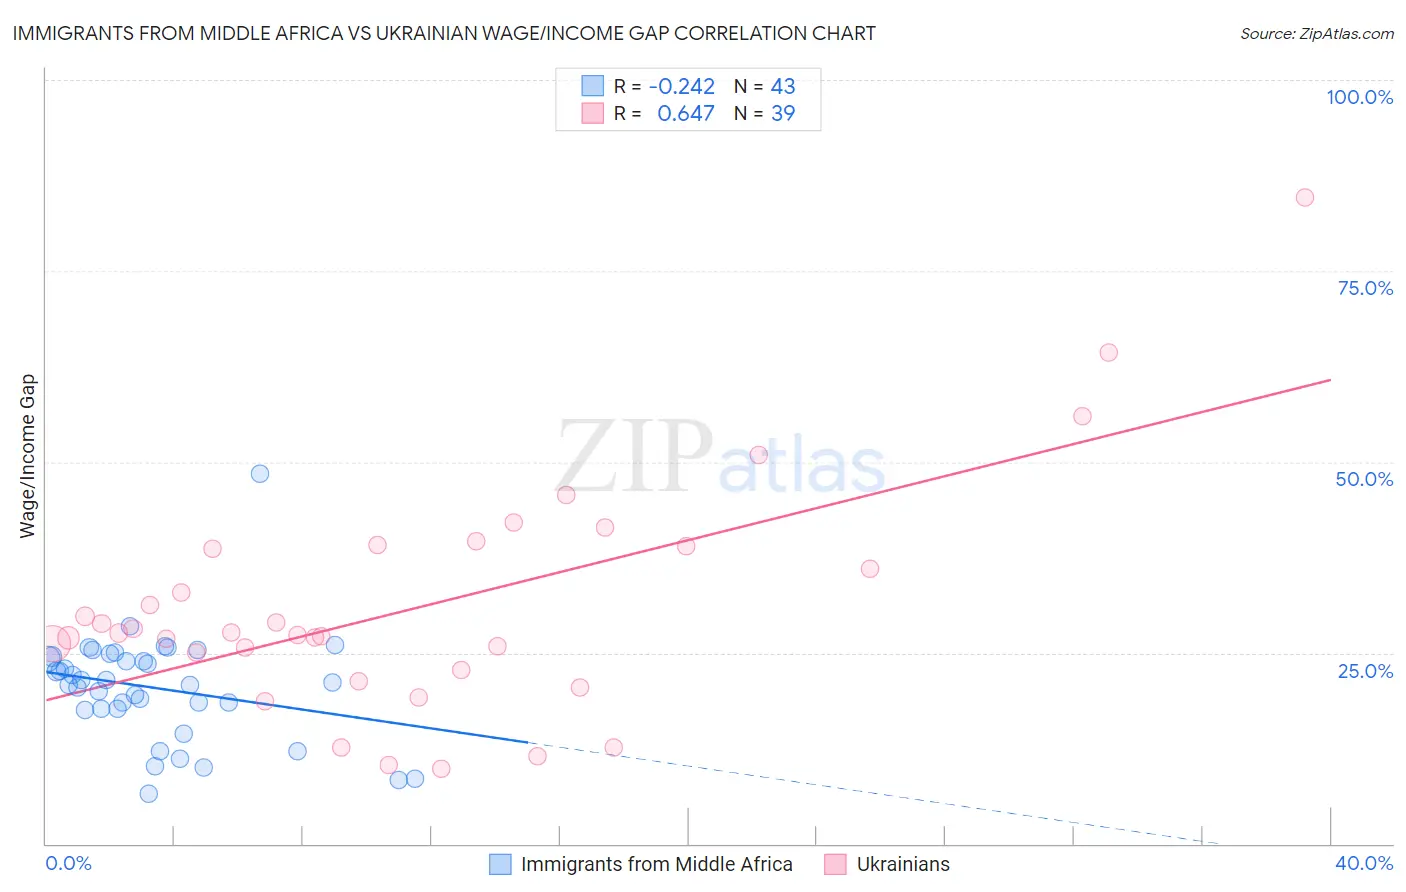
Immigrants from Middle Africa vs Ukrainian Wage/Income Gap Correlation Chart
The statistical analysis conducted on geographies consisting of 202,693,436 people shows a weak negative correlation between the proportion of Immigrants from Middle Africa and wage/income gap percentage in the United States with a correlation coefficient (R) of -0.242 and weighted average of 22.4%. Similarly, the statistical analysis conducted on geographies consisting of 448,085,539 people shows a significant positive correlation between the proportion of Ukrainians and wage/income gap percentage in the United States with a correlation coefficient (R) of 0.647 and weighted average of 27.3%, a difference of 22.1%.
Wage/Income Gap Correlation Summary
| Measurement | Immigrants from Middle Africa | Ukrainian |
| Minimum | 6.5% | 9.8% |
| Maximum | 48.4% | 84.6% |
| Range | 41.9% | 74.9% |
| Mean | 20.4% | 31.0% |
| Median | 21.1% | 27.6% |
| Interquartile 25% (IQ1) | 17.7% | 22.7% |
| Interquartile 75% (IQ3) | 24.5% | 39.0% |
| Interquartile Range (IQR) | 6.9% | 16.3% |
| Standard Deviation (Sample) | 7.1% | 14.9% |
| Standard Deviation (Population) | 7.1% | 14.7% |
Similar Demographics by Wage/Income Gap
Demographics Similar to Immigrants from Middle Africa by Wage/Income Gap
In terms of wage/income gap, the demographic groups most similar to Immigrants from Middle Africa are Navajo (22.4%, a difference of 0.020%), Immigrants from Cuba (22.4%, a difference of 0.060%), Ghanaian (22.3%, a difference of 0.14%), Immigrants from Fiji (22.4%, a difference of 0.17%), and Immigrants from Ghana (22.3%, a difference of 0.24%).
| Demographics | Rating | Rank | Wage/Income Gap |
| Bangladeshis | 100.0 /100 | #53 | Exceptional 22.2% |
| Nepalese | 100.0 /100 | #54 | Exceptional 22.2% |
| Immigrants | Zaire | 100.0 /100 | #55 | Exceptional 22.3% |
| Immigrants | Ghana | 100.0 /100 | #56 | Exceptional 22.3% |
| Ghanaians | 100.0 /100 | #57 | Exceptional 22.3% |
| Immigrants | Cuba | 100.0 /100 | #58 | Exceptional 22.4% |
| Navajo | 100.0 /100 | #59 | Exceptional 22.4% |
| Immigrants | Middle Africa | 100.0 /100 | #60 | Exceptional 22.4% |
| Immigrants | Fiji | 100.0 /100 | #61 | Exceptional 22.4% |
| Immigrants | Guatemala | 100.0 /100 | #62 | Exceptional 22.5% |
| Immigrants | Ecuador | 100.0 /100 | #63 | Exceptional 22.5% |
| Spanish American Indians | 100.0 /100 | #64 | Exceptional 22.5% |
| Guatemalans | 99.9 /100 | #65 | Exceptional 22.6% |
| Central American Indians | 99.9 /100 | #66 | Exceptional 22.7% |
| Menominee | 99.9 /100 | #67 | Exceptional 22.7% |
Demographics Similar to Ukrainians by Wage/Income Gap
In terms of wage/income gap, the demographic groups most similar to Ukrainians are Immigrants from Norway (27.3%, a difference of 0.060%), Immigrants from Czechoslovakia (27.3%, a difference of 0.16%), Portuguese (27.4%, a difference of 0.16%), Carpatho Rusyn (27.3%, a difference of 0.18%), and Cypriot (27.3%, a difference of 0.19%).
| Demographics | Rating | Rank | Wage/Income Gap |
| Immigrants | Azores | 3.5 /100 | #245 | Tragic 27.2% |
| Immigrants | Nonimmigrants | 3.3 /100 | #246 | Tragic 27.2% |
| Celtics | 2.8 /100 | #247 | Tragic 27.3% |
| Cypriots | 2.8 /100 | #248 | Tragic 27.3% |
| Carpatho Rusyns | 2.7 /100 | #249 | Tragic 27.3% |
| Immigrants | Czechoslovakia | 2.7 /100 | #250 | Tragic 27.3% |
| Immigrants | Norway | 2.5 /100 | #251 | Tragic 27.3% |
| Ukrainians | 2.4 /100 | #252 | Tragic 27.3% |
| Portuguese | 2.2 /100 | #253 | Tragic 27.4% |
| Israelis | 2.1 /100 | #254 | Tragic 27.4% |
| Immigrants | France | 2.1 /100 | #255 | Tragic 27.4% |
| Cherokee | 1.9 /100 | #256 | Tragic 27.4% |
| Luxembourgers | 1.9 /100 | #257 | Tragic 27.4% |
| Slavs | 1.8 /100 | #258 | Tragic 27.4% |
| Icelanders | 1.8 /100 | #259 | Tragic 27.5% |