Immigrants from Eastern Asia vs Ukrainian Wage/Income Gap
COMPARE
Immigrants from Eastern Asia
Ukrainian
Wage/Income Gap
Wage/Income Gap Comparison
Immigrants from Eastern Asia
Ukrainians
27.1%
WAGE/INCOME GAP
4.4/ 100
METRIC RATING
237th/ 347
METRIC RANK
27.3%
WAGE/INCOME GAP
2.4/ 100
METRIC RATING
252nd/ 347
METRIC RANK
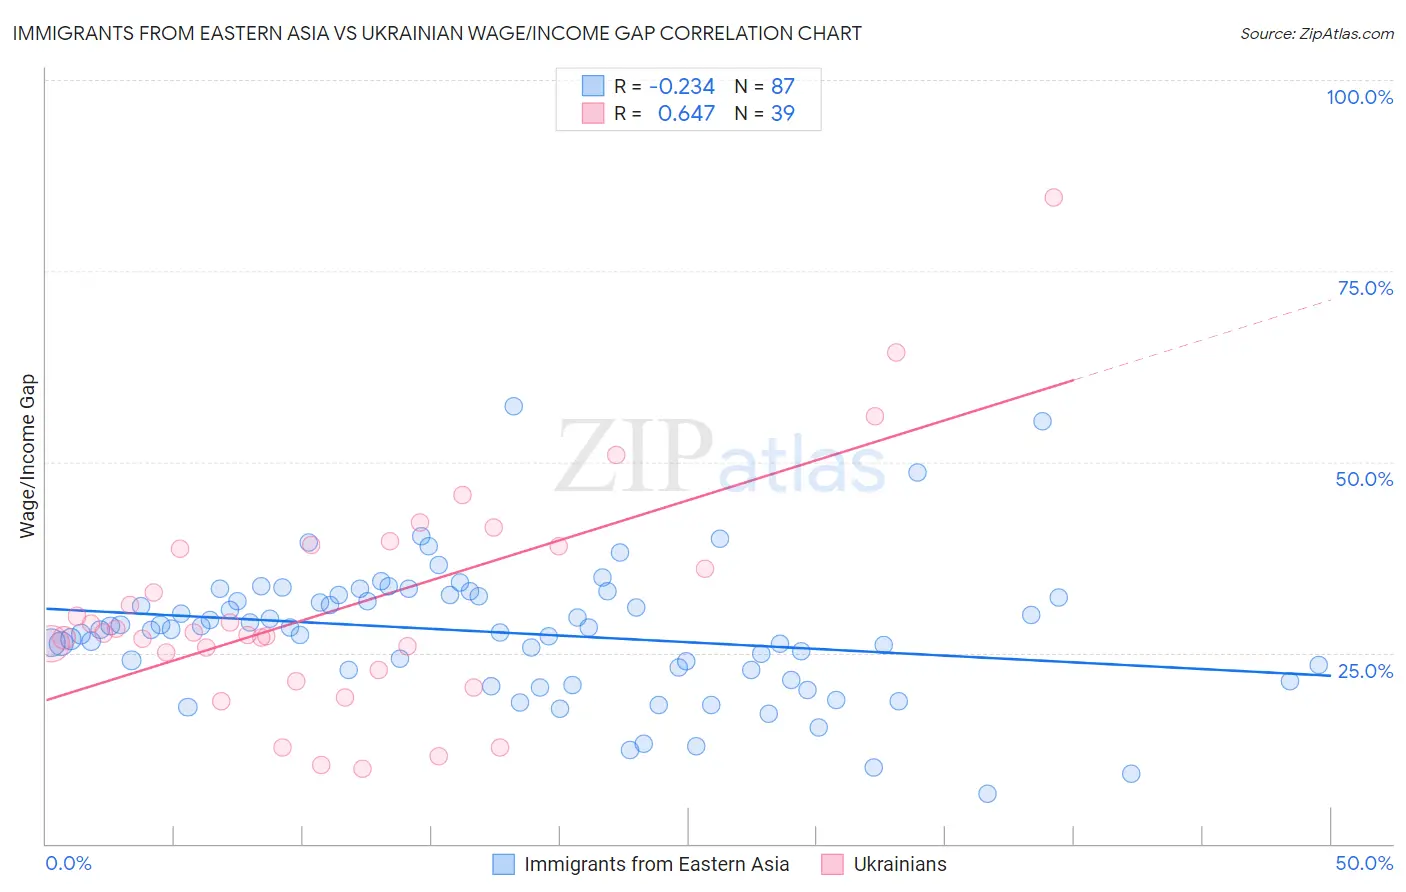
Immigrants from Eastern Asia vs Ukrainian Wage/Income Gap Correlation Chart
The statistical analysis conducted on geographies consisting of 499,229,662 people shows a weak negative correlation between the proportion of Immigrants from Eastern Asia and wage/income gap percentage in the United States with a correlation coefficient (R) of -0.234 and weighted average of 27.1%. Similarly, the statistical analysis conducted on geographies consisting of 448,085,539 people shows a significant positive correlation between the proportion of Ukrainians and wage/income gap percentage in the United States with a correlation coefficient (R) of 0.647 and weighted average of 27.3%, a difference of 0.93%.
Wage/Income Gap Correlation Summary
| Measurement | Immigrants from Eastern Asia | Ukrainian |
| Minimum | 6.5% | 9.8% |
| Maximum | 57.3% | 84.6% |
| Range | 50.8% | 74.9% |
| Mean | 27.6% | 31.0% |
| Median | 28.1% | 27.6% |
| Interquartile 25% (IQ1) | 22.7% | 22.7% |
| Interquartile 75% (IQ3) | 32.5% | 39.0% |
| Interquartile Range (IQR) | 9.8% | 16.3% |
| Standard Deviation (Sample) | 8.7% | 14.9% |
| Standard Deviation (Population) | 8.7% | 14.7% |
Demographics Similar to Immigrants from Eastern Asia and Ukrainians by Wage/Income Gap
In terms of wage/income gap, the demographic groups most similar to Immigrants from Eastern Asia are Osage (27.1%, a difference of 0.0%), Estonian (27.1%, a difference of 0.030%), Immigrants from Romania (27.0%, a difference of 0.15%), Immigrants from Hungary (27.0%, a difference of 0.16%), and Immigrants from Pakistan (27.0%, a difference of 0.18%). Similarly, the demographic groups most similar to Ukrainians are Immigrants from Norway (27.3%, a difference of 0.060%), Immigrants from Czechoslovakia (27.3%, a difference of 0.16%), Portuguese (27.4%, a difference of 0.16%), Carpatho Rusyn (27.3%, a difference of 0.18%), and Cypriot (27.3%, a difference of 0.19%).
| Demographics | Rating | Rank | Wage/Income Gap |
| Immigrants | Pakistan | 4.9 /100 | #234 | Tragic 27.0% |
| Immigrants | Hungary | 4.8 /100 | #235 | Tragic 27.0% |
| Immigrants | Romania | 4.8 /100 | #236 | Tragic 27.0% |
| Immigrants | Eastern Asia | 4.4 /100 | #237 | Tragic 27.1% |
| Osage | 4.4 /100 | #238 | Tragic 27.1% |
| Estonians | 4.3 /100 | #239 | Tragic 27.1% |
| Immigrants | Europe | 3.8 /100 | #240 | Tragic 27.1% |
| Creek | 3.8 /100 | #241 | Tragic 27.1% |
| Immigrants | Sri Lanka | 3.7 /100 | #242 | Tragic 27.1% |
| Spanish | 3.6 /100 | #243 | Tragic 27.1% |
| Chickasaw | 3.5 /100 | #244 | Tragic 27.2% |
| Immigrants | Azores | 3.5 /100 | #245 | Tragic 27.2% |
| Immigrants | Nonimmigrants | 3.3 /100 | #246 | Tragic 27.2% |
| Celtics | 2.8 /100 | #247 | Tragic 27.3% |
| Cypriots | 2.8 /100 | #248 | Tragic 27.3% |
| Carpatho Rusyns | 2.7 /100 | #249 | Tragic 27.3% |
| Immigrants | Czechoslovakia | 2.7 /100 | #250 | Tragic 27.3% |
| Immigrants | Norway | 2.5 /100 | #251 | Tragic 27.3% |
| Ukrainians | 2.4 /100 | #252 | Tragic 27.3% |
| Portuguese | 2.2 /100 | #253 | Tragic 27.4% |
| Israelis | 2.1 /100 | #254 | Tragic 27.4% |