Immigrants from Jamaica vs Ukrainian Wage/Income Gap
COMPARE
Immigrants from Jamaica
Ukrainian
Wage/Income Gap
Wage/Income Gap Comparison
Immigrants from Jamaica
Ukrainians
18.8%
WAGE/INCOME GAP
100.0/ 100
METRIC RATING
8th/ 347
METRIC RANK
27.3%
WAGE/INCOME GAP
2.4/ 100
METRIC RATING
252nd/ 347
METRIC RANK
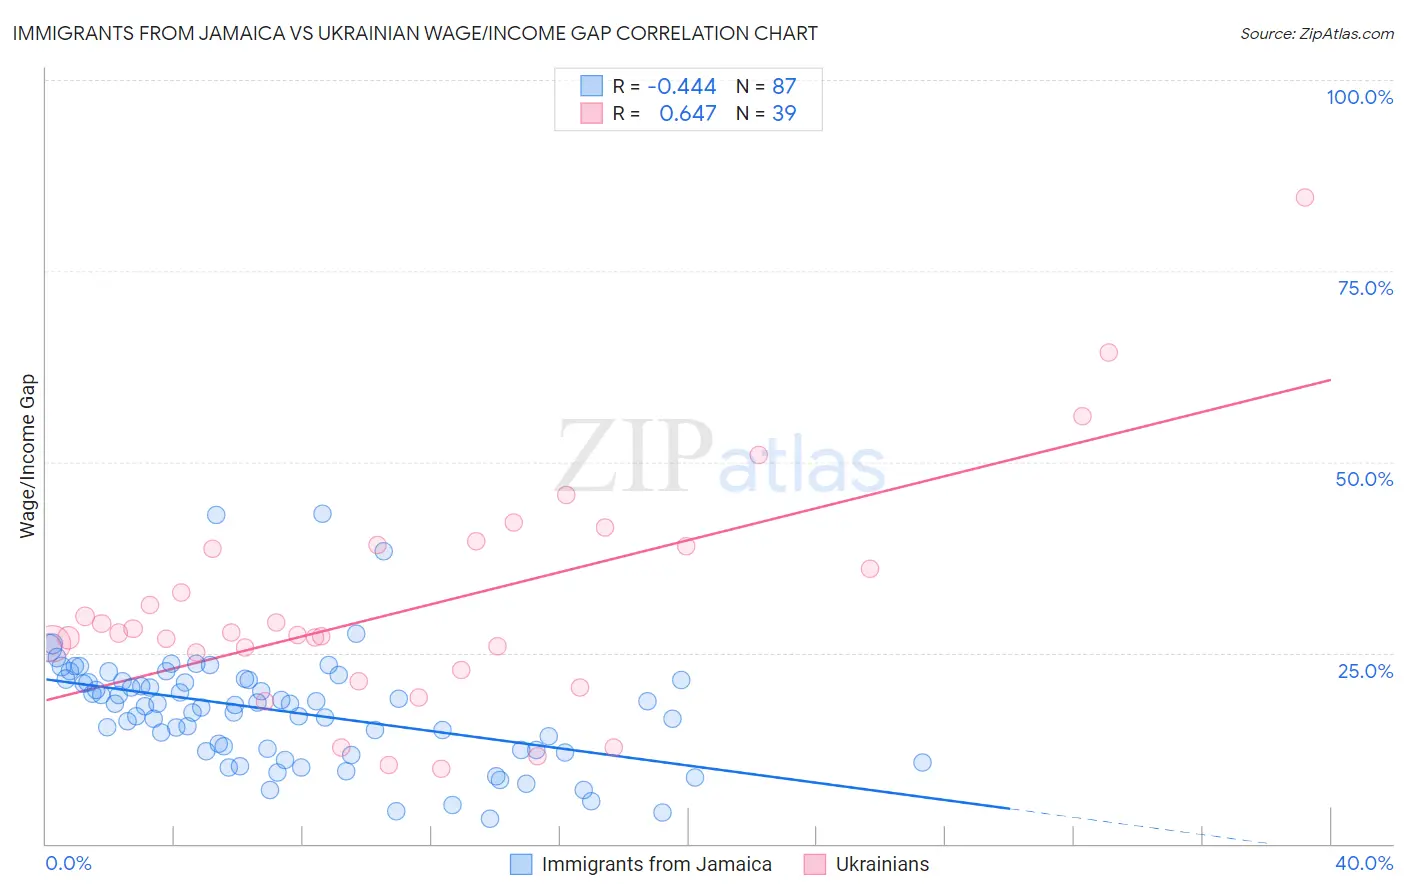
Immigrants from Jamaica vs Ukrainian Wage/Income Gap Correlation Chart
The statistical analysis conducted on geographies consisting of 301,660,562 people shows a moderate negative correlation between the proportion of Immigrants from Jamaica and wage/income gap percentage in the United States with a correlation coefficient (R) of -0.444 and weighted average of 18.8%. Similarly, the statistical analysis conducted on geographies consisting of 448,085,539 people shows a significant positive correlation between the proportion of Ukrainians and wage/income gap percentage in the United States with a correlation coefficient (R) of 0.647 and weighted average of 27.3%, a difference of 45.0%.
Wage/Income Gap Correlation Summary
| Measurement | Immigrants from Jamaica | Ukrainian |
| Minimum | 3.2% | 9.8% |
| Maximum | 43.2% | 84.6% |
| Range | 40.0% | 74.9% |
| Mean | 17.4% | 31.0% |
| Median | 18.2% | 27.6% |
| Interquartile 25% (IQ1) | 12.2% | 22.7% |
| Interquartile 75% (IQ3) | 21.4% | 39.0% |
| Interquartile Range (IQR) | 9.2% | 16.3% |
| Standard Deviation (Sample) | 7.3% | 14.9% |
| Standard Deviation (Population) | 7.3% | 14.7% |
Similar Demographics by Wage/Income Gap
Demographics Similar to Immigrants from Jamaica by Wage/Income Gap
In terms of wage/income gap, the demographic groups most similar to Immigrants from Jamaica are Puerto Rican (18.7%, a difference of 0.63%), Barbadian (19.0%, a difference of 0.66%), Crow (19.1%, a difference of 1.2%), Immigrants from Haiti (19.2%, a difference of 2.0%), and Immigrants from West Indies (19.2%, a difference of 2.1%).
| Demographics | Rating | Rank | Wage/Income Gap |
| Immigrants | Grenada | 100.0 /100 | #1 | Exceptional 16.2% |
| Immigrants | St. Vincent and the Grenadines | 100.0 /100 | #2 | Exceptional 16.4% |
| Immigrants | Barbados | 100.0 /100 | #3 | Exceptional 17.8% |
| British West Indians | 100.0 /100 | #4 | Exceptional 18.0% |
| Guyanese | 100.0 /100 | #5 | Exceptional 18.3% |
| Immigrants | Guyana | 100.0 /100 | #6 | Exceptional 18.4% |
| Puerto Ricans | 100.0 /100 | #7 | Exceptional 18.7% |
| Immigrants | Jamaica | 100.0 /100 | #8 | Exceptional 18.8% |
| Barbadians | 100.0 /100 | #9 | Exceptional 19.0% |
| Crow | 100.0 /100 | #10 | Exceptional 19.1% |
| Immigrants | Haiti | 100.0 /100 | #11 | Exceptional 19.2% |
| Immigrants | West Indies | 100.0 /100 | #12 | Exceptional 19.2% |
| Trinidadians and Tobagonians | 100.0 /100 | #13 | Exceptional 19.3% |
| Immigrants | Trinidad and Tobago | 100.0 /100 | #14 | Exceptional 19.3% |
| West Indians | 100.0 /100 | #15 | Exceptional 19.6% |
Demographics Similar to Ukrainians by Wage/Income Gap
In terms of wage/income gap, the demographic groups most similar to Ukrainians are Immigrants from Norway (27.3%, a difference of 0.060%), Immigrants from Czechoslovakia (27.3%, a difference of 0.16%), Portuguese (27.4%, a difference of 0.16%), Carpatho Rusyn (27.3%, a difference of 0.18%), and Cypriot (27.3%, a difference of 0.19%).
| Demographics | Rating | Rank | Wage/Income Gap |
| Immigrants | Azores | 3.5 /100 | #245 | Tragic 27.2% |
| Immigrants | Nonimmigrants | 3.3 /100 | #246 | Tragic 27.2% |
| Celtics | 2.8 /100 | #247 | Tragic 27.3% |
| Cypriots | 2.8 /100 | #248 | Tragic 27.3% |
| Carpatho Rusyns | 2.7 /100 | #249 | Tragic 27.3% |
| Immigrants | Czechoslovakia | 2.7 /100 | #250 | Tragic 27.3% |
| Immigrants | Norway | 2.5 /100 | #251 | Tragic 27.3% |
| Ukrainians | 2.4 /100 | #252 | Tragic 27.3% |
| Portuguese | 2.2 /100 | #253 | Tragic 27.4% |
| Israelis | 2.1 /100 | #254 | Tragic 27.4% |
| Immigrants | France | 2.1 /100 | #255 | Tragic 27.4% |
| Cherokee | 1.9 /100 | #256 | Tragic 27.4% |
| Luxembourgers | 1.9 /100 | #257 | Tragic 27.4% |
| Slavs | 1.8 /100 | #258 | Tragic 27.4% |
| Icelanders | 1.8 /100 | #259 | Tragic 27.5% |