Immigrants from Iran vs Ukrainian Wage/Income Gap
COMPARE
Immigrants from Iran
Ukrainian
Wage/Income Gap
Wage/Income Gap Comparison
Immigrants from Iran
Ukrainians
29.1%
WAGE/INCOME GAP
0.0/ 100
METRIC RATING
327th/ 347
METRIC RANK
27.3%
WAGE/INCOME GAP
2.4/ 100
METRIC RATING
252nd/ 347
METRIC RANK
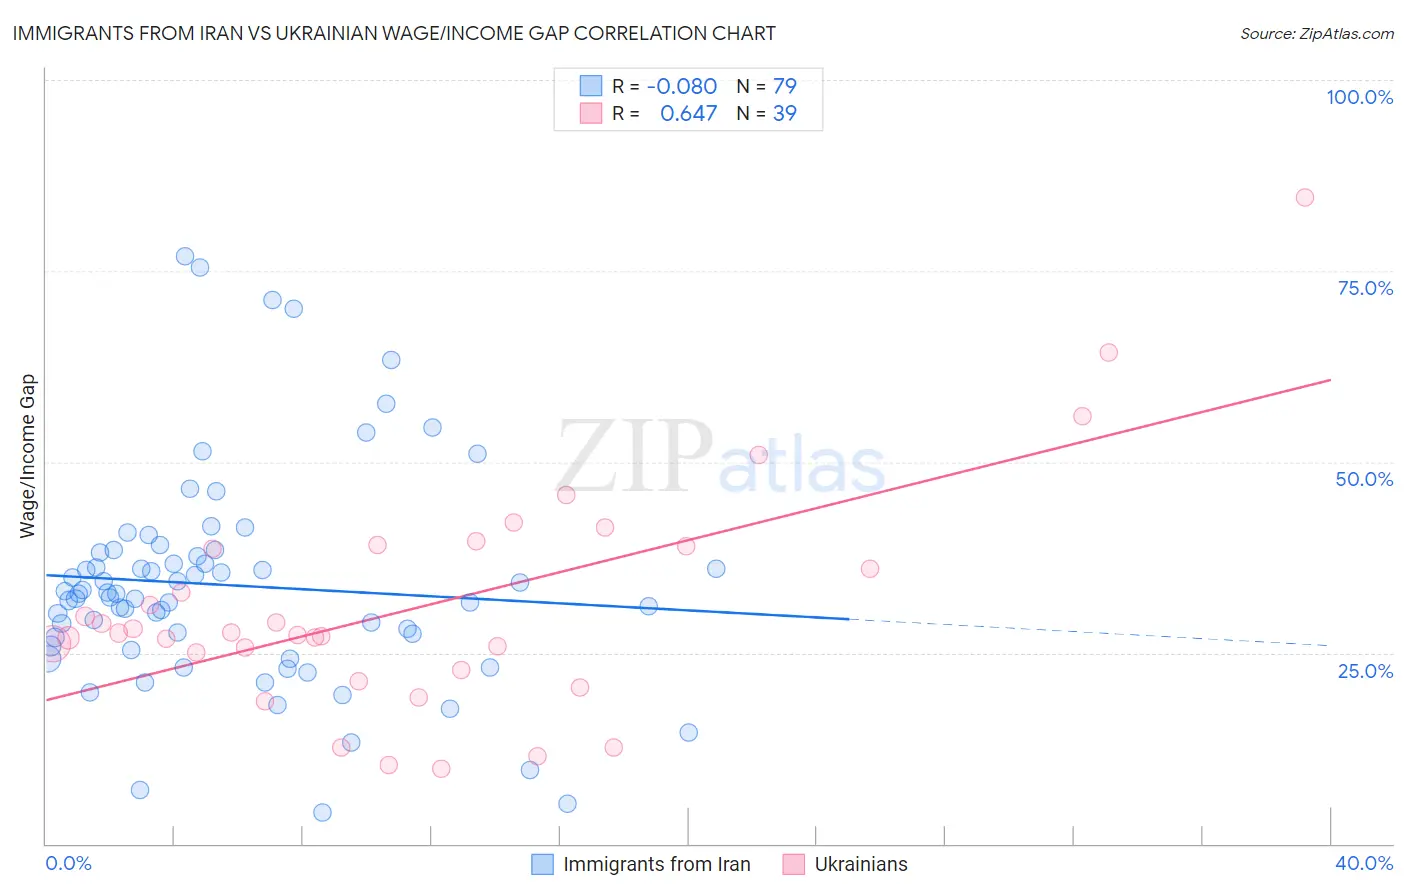
Immigrants from Iran vs Ukrainian Wage/Income Gap Correlation Chart
The statistical analysis conducted on geographies consisting of 279,798,376 people shows a slight negative correlation between the proportion of Immigrants from Iran and wage/income gap percentage in the United States with a correlation coefficient (R) of -0.080 and weighted average of 29.1%. Similarly, the statistical analysis conducted on geographies consisting of 448,085,539 people shows a significant positive correlation between the proportion of Ukrainians and wage/income gap percentage in the United States with a correlation coefficient (R) of 0.647 and weighted average of 27.3%, a difference of 6.4%.
Wage/Income Gap Correlation Summary
| Measurement | Immigrants from Iran | Ukrainian |
| Minimum | 4.0% | 9.8% |
| Maximum | 77.0% | 84.6% |
| Range | 73.0% | 74.9% |
| Mean | 33.8% | 31.0% |
| Median | 32.7% | 27.6% |
| Interquartile 25% (IQ1) | 25.9% | 22.7% |
| Interquartile 75% (IQ3) | 38.2% | 39.0% |
| Interquartile Range (IQR) | 12.3% | 16.3% |
| Standard Deviation (Sample) | 14.3% | 14.9% |
| Standard Deviation (Population) | 14.2% | 14.7% |
Similar Demographics by Wage/Income Gap
Demographics Similar to Immigrants from Iran by Wage/Income Gap
In terms of wage/income gap, the demographic groups most similar to Immigrants from Iran are Scandinavian (29.1%, a difference of 0.060%), Immigrants from Belgium (29.0%, a difference of 0.11%), Hungarian (29.0%, a difference of 0.18%), Scottish (29.1%, a difference of 0.20%), and German (29.2%, a difference of 0.30%).
| Demographics | Rating | Rank | Wage/Income Gap |
| British | 0.1 /100 | #320 | Tragic 28.9% |
| Welsh | 0.1 /100 | #321 | Tragic 28.9% |
| Immigrants | Singapore | 0.1 /100 | #322 | Tragic 28.9% |
| Norwegians | 0.1 /100 | #323 | Tragic 29.0% |
| Croatians | 0.0 /100 | #324 | Tragic 29.0% |
| Hungarians | 0.0 /100 | #325 | Tragic 29.0% |
| Immigrants | Belgium | 0.0 /100 | #326 | Tragic 29.0% |
| Immigrants | Iran | 0.0 /100 | #327 | Tragic 29.1% |
| Scandinavians | 0.0 /100 | #328 | Tragic 29.1% |
| Scottish | 0.0 /100 | #329 | Tragic 29.1% |
| Germans | 0.0 /100 | #330 | Tragic 29.2% |
| Czechs | 0.0 /100 | #331 | Tragic 29.2% |
| Immigrants | South Central Asia | 0.0 /100 | #332 | Tragic 29.3% |
| Europeans | 0.0 /100 | #333 | Tragic 29.4% |
| Swedes | 0.0 /100 | #334 | Tragic 29.4% |
Demographics Similar to Ukrainians by Wage/Income Gap
In terms of wage/income gap, the demographic groups most similar to Ukrainians are Immigrants from Norway (27.3%, a difference of 0.060%), Immigrants from Czechoslovakia (27.3%, a difference of 0.16%), Portuguese (27.4%, a difference of 0.16%), Carpatho Rusyn (27.3%, a difference of 0.18%), and Cypriot (27.3%, a difference of 0.19%).
| Demographics | Rating | Rank | Wage/Income Gap |
| Immigrants | Azores | 3.5 /100 | #245 | Tragic 27.2% |
| Immigrants | Nonimmigrants | 3.3 /100 | #246 | Tragic 27.2% |
| Celtics | 2.8 /100 | #247 | Tragic 27.3% |
| Cypriots | 2.8 /100 | #248 | Tragic 27.3% |
| Carpatho Rusyns | 2.7 /100 | #249 | Tragic 27.3% |
| Immigrants | Czechoslovakia | 2.7 /100 | #250 | Tragic 27.3% |
| Immigrants | Norway | 2.5 /100 | #251 | Tragic 27.3% |
| Ukrainians | 2.4 /100 | #252 | Tragic 27.3% |
| Portuguese | 2.2 /100 | #253 | Tragic 27.4% |
| Israelis | 2.1 /100 | #254 | Tragic 27.4% |
| Immigrants | France | 2.1 /100 | #255 | Tragic 27.4% |
| Cherokee | 1.9 /100 | #256 | Tragic 27.4% |
| Luxembourgers | 1.9 /100 | #257 | Tragic 27.4% |
| Slavs | 1.8 /100 | #258 | Tragic 27.4% |
| Icelanders | 1.8 /100 | #259 | Tragic 27.5% |