Hispanic or Latino vs Subsaharan African Wage/Income Gap
COMPARE
Hispanic or Latino
Subsaharan African
Wage/Income Gap
Wage/Income Gap Comparison
Hispanics or Latinos
Sub-Saharan Africans
24.9%
WAGE/INCOME GAP
89.5/ 100
METRIC RATING
139th/ 347
METRIC RANK
22.8%
WAGE/INCOME GAP
99.9/ 100
METRIC RATING
72nd/ 347
METRIC RANK
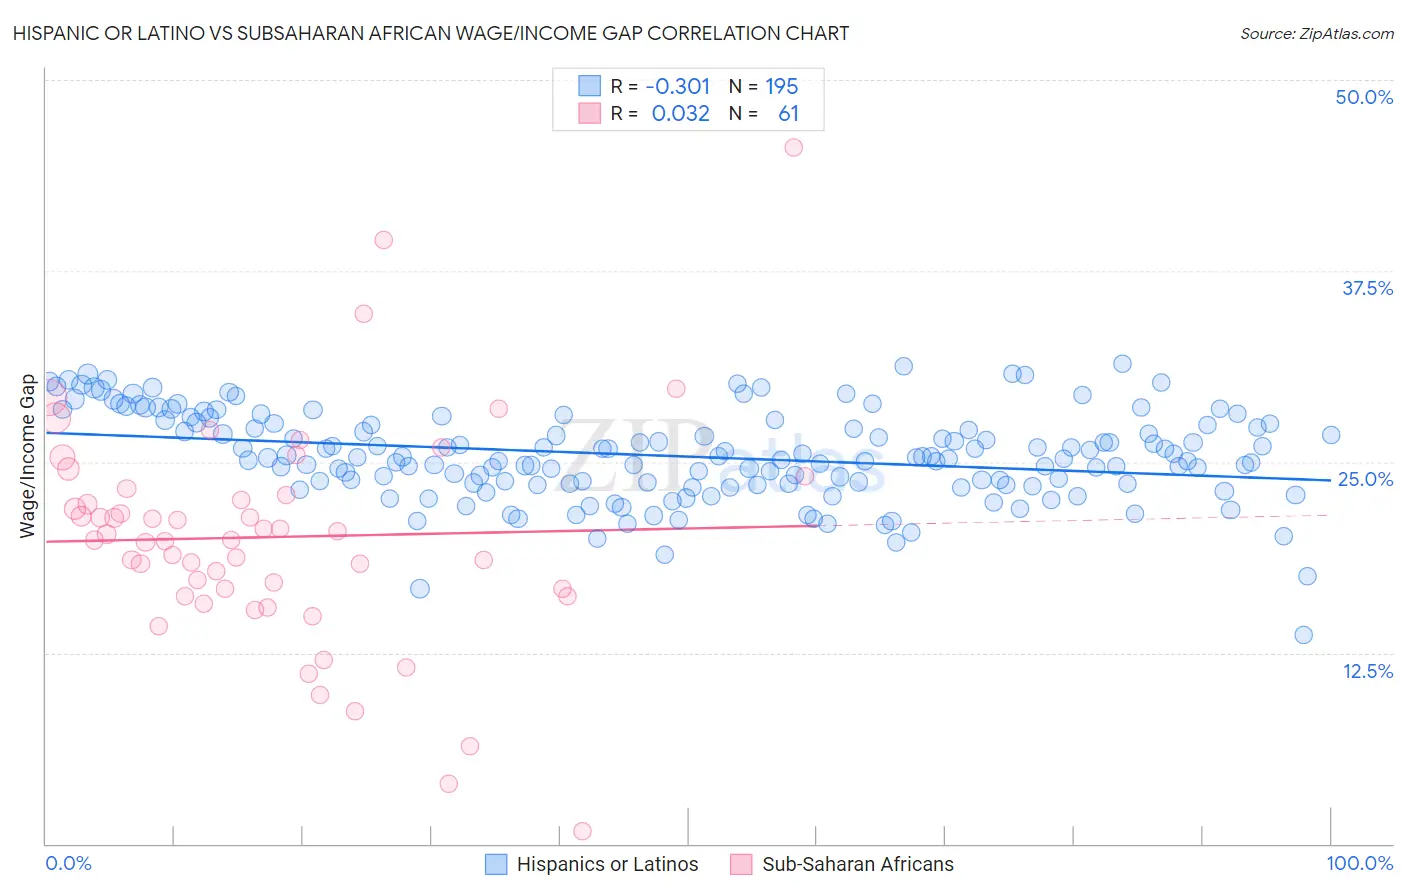
Hispanic or Latino vs Subsaharan African Wage/Income Gap Correlation Chart
The statistical analysis conducted on geographies consisting of 570,699,475 people shows a mild negative correlation between the proportion of Hispanics or Latinos and wage/income gap percentage in the United States with a correlation coefficient (R) of -0.301 and weighted average of 24.9%. Similarly, the statistical analysis conducted on geographies consisting of 507,315,173 people shows no correlation between the proportion of Sub-Saharan Africans and wage/income gap percentage in the United States with a correlation coefficient (R) of 0.032 and weighted average of 22.8%, a difference of 9.0%.
Wage/Income Gap Correlation Summary
| Measurement | Hispanic or Latino | Subsaharan African |
| Minimum | 13.7% | 0.79% |
| Maximum | 31.5% | 45.6% |
| Range | 17.8% | 44.8% |
| Mean | 25.4% | 20.1% |
| Median | 25.3% | 19.9% |
| Interquartile 25% (IQ1) | 23.6% | 16.4% |
| Interquartile 75% (IQ3) | 27.5% | 23.0% |
| Interquartile Range (IQR) | 3.9% | 6.6% |
| Standard Deviation (Sample) | 2.9% | 7.4% |
| Standard Deviation (Population) | 2.9% | 7.4% |
Similar Demographics by Wage/Income Gap
Demographics Similar to Hispanics or Latinos by Wage/Income Gap
In terms of wage/income gap, the demographic groups most similar to Hispanics or Latinos are Immigrants from Nepal (24.9%, a difference of 0.030%), Hawaiian (24.9%, a difference of 0.040%), Immigrants from Bosnia and Herzegovina (24.8%, a difference of 0.11%), Afghan (24.9%, a difference of 0.24%), and Immigrants from Uganda (24.9%, a difference of 0.25%).
| Demographics | Rating | Rank | Wage/Income Gap |
| Immigrants | Costa Rica | 92.4 /100 | #132 | Exceptional 24.7% |
| Colombians | 92.4 /100 | #133 | Exceptional 24.7% |
| Mexican American Indians | 92.2 /100 | #134 | Exceptional 24.7% |
| South American Indians | 92.0 /100 | #135 | Exceptional 24.7% |
| Armenians | 91.3 /100 | #136 | Exceptional 24.8% |
| Immigrants | South Eastern Asia | 90.9 /100 | #137 | Exceptional 24.8% |
| Immigrants | Bosnia and Herzegovina | 90.1 /100 | #138 | Exceptional 24.8% |
| Hispanics or Latinos | 89.5 /100 | #139 | Excellent 24.9% |
| Immigrants | Nepal | 89.3 /100 | #140 | Excellent 24.9% |
| Hawaiians | 89.3 /100 | #141 | Excellent 24.9% |
| Afghans | 88.1 /100 | #142 | Excellent 24.9% |
| Immigrants | Uganda | 88.0 /100 | #143 | Excellent 24.9% |
| Chippewa | 86.9 /100 | #144 | Excellent 25.0% |
| Comanche | 85.2 /100 | #145 | Excellent 25.0% |
| South Americans | 85.2 /100 | #146 | Excellent 25.0% |
Demographics Similar to Sub-Saharan Africans by Wage/Income Gap
In terms of wage/income gap, the demographic groups most similar to Sub-Saharan Africans are Immigrants from Eastern Africa (22.8%, a difference of 0.030%), Immigrants from Burma/Myanmar (22.8%, a difference of 0.11%), Immigrants from El Salvador (22.8%, a difference of 0.15%), Immigrants from Uzbekistan (22.7%, a difference of 0.31%), and Fijian (22.9%, a difference of 0.39%).
| Demographics | Rating | Rank | Wage/Income Gap |
| Guatemalans | 99.9 /100 | #65 | Exceptional 22.6% |
| Central American Indians | 99.9 /100 | #66 | Exceptional 22.7% |
| Menominee | 99.9 /100 | #67 | Exceptional 22.7% |
| Immigrants | Nigeria | 99.9 /100 | #68 | Exceptional 22.7% |
| Indonesians | 99.9 /100 | #69 | Exceptional 22.7% |
| Immigrants | Uzbekistan | 99.9 /100 | #70 | Exceptional 22.7% |
| Immigrants | El Salvador | 99.9 /100 | #71 | Exceptional 22.8% |
| Sub-Saharan Africans | 99.9 /100 | #72 | Exceptional 22.8% |
| Immigrants | Eastern Africa | 99.9 /100 | #73 | Exceptional 22.8% |
| Immigrants | Burma/Myanmar | 99.9 /100 | #74 | Exceptional 22.8% |
| Fijians | 99.9 /100 | #75 | Exceptional 22.9% |
| Ecuadorians | 99.9 /100 | #76 | Exceptional 22.9% |
| Africans | 99.9 /100 | #77 | Exceptional 22.9% |
| Nigerians | 99.9 /100 | #78 | Exceptional 23.0% |
| Immigrants | Nicaragua | 99.9 /100 | #79 | Exceptional 23.0% |