Hispanic or Latino vs Costa Rican Wage/Income Gap
COMPARE
Hispanic or Latino
Costa Rican
Wage/Income Gap
Wage/Income Gap Comparison
Hispanics or Latinos
Costa Ricans
24.9%
WAGE/INCOME GAP
89.5/ 100
METRIC RATING
139th/ 347
METRIC RANK
25.3%
WAGE/INCOME GAP
75.8/ 100
METRIC RATING
157th/ 347
METRIC RANK
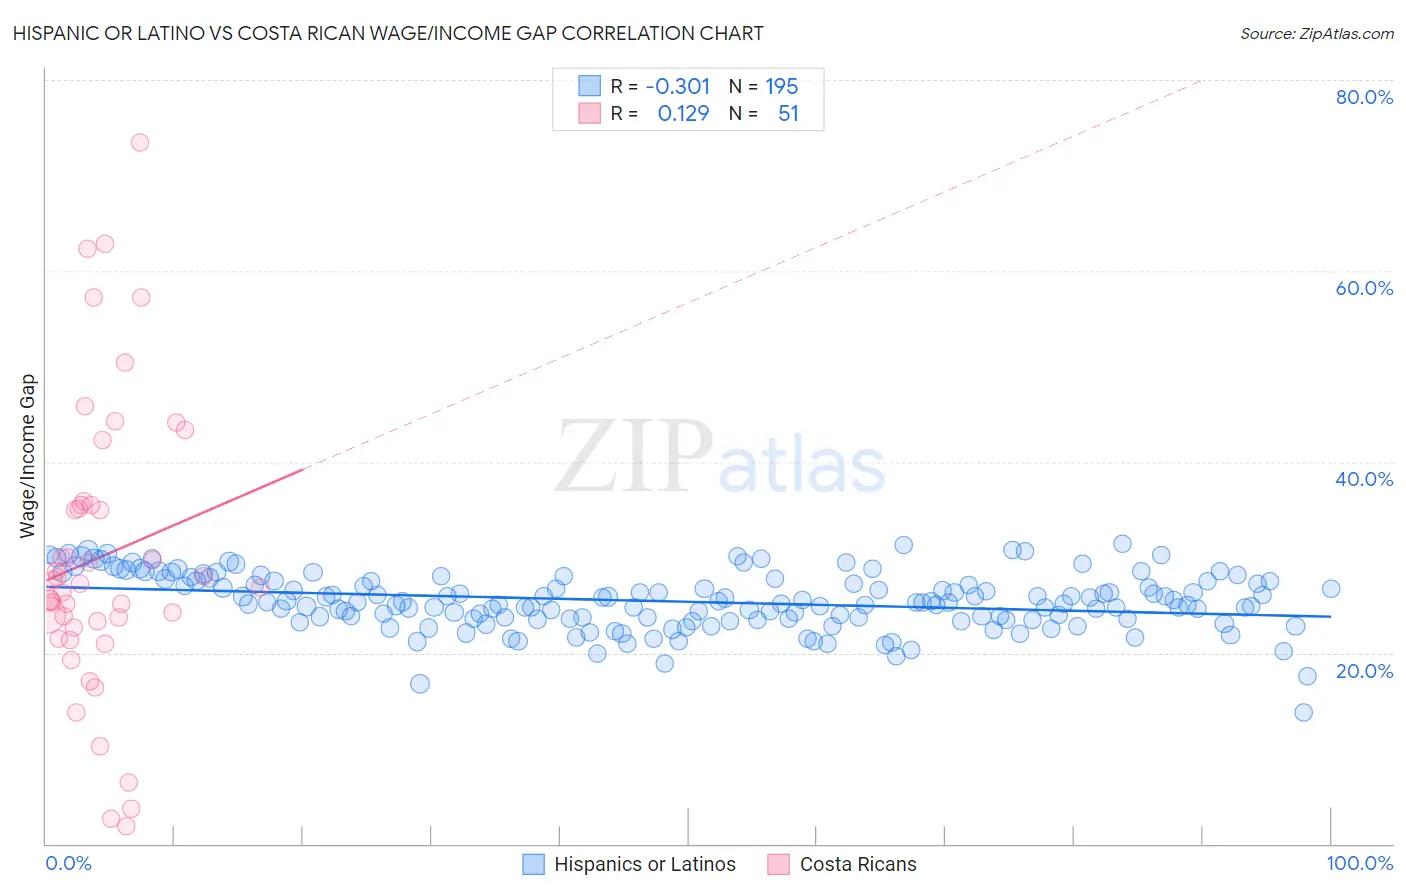
Hispanic or Latino vs Costa Rican Wage/Income Gap Correlation Chart
The statistical analysis conducted on geographies consisting of 570,699,475 people shows a mild negative correlation between the proportion of Hispanics or Latinos and wage/income gap percentage in the United States with a correlation coefficient (R) of -0.301 and weighted average of 24.9%. Similarly, the statistical analysis conducted on geographies consisting of 253,543,370 people shows a poor positive correlation between the proportion of Costa Ricans and wage/income gap percentage in the United States with a correlation coefficient (R) of 0.129 and weighted average of 25.3%, a difference of 1.7%.
Wage/Income Gap Correlation Summary
| Measurement | Hispanic or Latino | Costa Rican |
| Minimum | 13.7% | 1.8% |
| Maximum | 31.5% | 73.5% |
| Range | 17.8% | 71.7% |
| Mean | 25.4% | 30.0% |
| Median | 25.3% | 27.2% |
| Interquartile 25% (IQ1) | 23.6% | 22.7% |
| Interquartile 75% (IQ3) | 27.5% | 35.5% |
| Interquartile Range (IQR) | 3.9% | 12.9% |
| Standard Deviation (Sample) | 2.9% | 15.2% |
| Standard Deviation (Population) | 2.9% | 15.1% |
Demographics Similar to Hispanics or Latinos and Costa Ricans by Wage/Income Gap
In terms of wage/income gap, the demographic groups most similar to Hispanics or Latinos are Immigrants from Nepal (24.9%, a difference of 0.030%), Hawaiian (24.9%, a difference of 0.040%), Immigrants from Bosnia and Herzegovina (24.8%, a difference of 0.11%), Afghan (24.9%, a difference of 0.24%), and Immigrants from Uganda (24.9%, a difference of 0.25%). Similarly, the demographic groups most similar to Costa Ricans are Immigrants from Mexico (25.3%, a difference of 0.060%), Immigrants from Vietnam (25.2%, a difference of 0.18%), Immigrants from Zimbabwe (25.3%, a difference of 0.18%), Blackfeet (25.2%, a difference of 0.22%), and Immigrants from Northern Africa (25.2%, a difference of 0.22%).
| Demographics | Rating | Rank | Wage/Income Gap |
| Immigrants | Bosnia and Herzegovina | 90.1 /100 | #138 | Exceptional 24.8% |
| Hispanics or Latinos | 89.5 /100 | #139 | Excellent 24.9% |
| Immigrants | Nepal | 89.3 /100 | #140 | Excellent 24.9% |
| Hawaiians | 89.3 /100 | #141 | Excellent 24.9% |
| Afghans | 88.1 /100 | #142 | Excellent 24.9% |
| Immigrants | Uganda | 88.0 /100 | #143 | Excellent 24.9% |
| Chippewa | 86.9 /100 | #144 | Excellent 25.0% |
| Comanche | 85.2 /100 | #145 | Excellent 25.0% |
| South Americans | 85.2 /100 | #146 | Excellent 25.0% |
| Malaysians | 84.9 /100 | #147 | Excellent 25.0% |
| Iroquois | 83.9 /100 | #148 | Excellent 25.1% |
| Immigrants | Peru | 82.6 /100 | #149 | Excellent 25.1% |
| Immigrants | Immigrants | 82.3 /100 | #150 | Excellent 25.1% |
| Taiwanese | 81.6 /100 | #151 | Excellent 25.1% |
| Uruguayans | 81.3 /100 | #152 | Excellent 25.2% |
| Blackfeet | 78.1 /100 | #153 | Good 25.2% |
| Immigrants | Northern Africa | 78.1 /100 | #154 | Good 25.2% |
| Immigrants | Vietnam | 77.7 /100 | #155 | Good 25.2% |
| Immigrants | Mexico | 76.4 /100 | #156 | Good 25.3% |
| Costa Ricans | 75.8 /100 | #157 | Good 25.3% |
| Immigrants | Zimbabwe | 73.7 /100 | #158 | Good 25.3% |