Hispanic or Latino vs Immigrants from Afghanistan Wage/Income Gap
COMPARE
Hispanic or Latino
Immigrants from Afghanistan
Wage/Income Gap
Wage/Income Gap Comparison
Hispanics or Latinos
Immigrants from Afghanistan
24.9%
WAGE/INCOME GAP
89.5/ 100
METRIC RATING
139th/ 347
METRIC RANK
24.4%
WAGE/INCOME GAP
95.9/ 100
METRIC RATING
117th/ 347
METRIC RANK
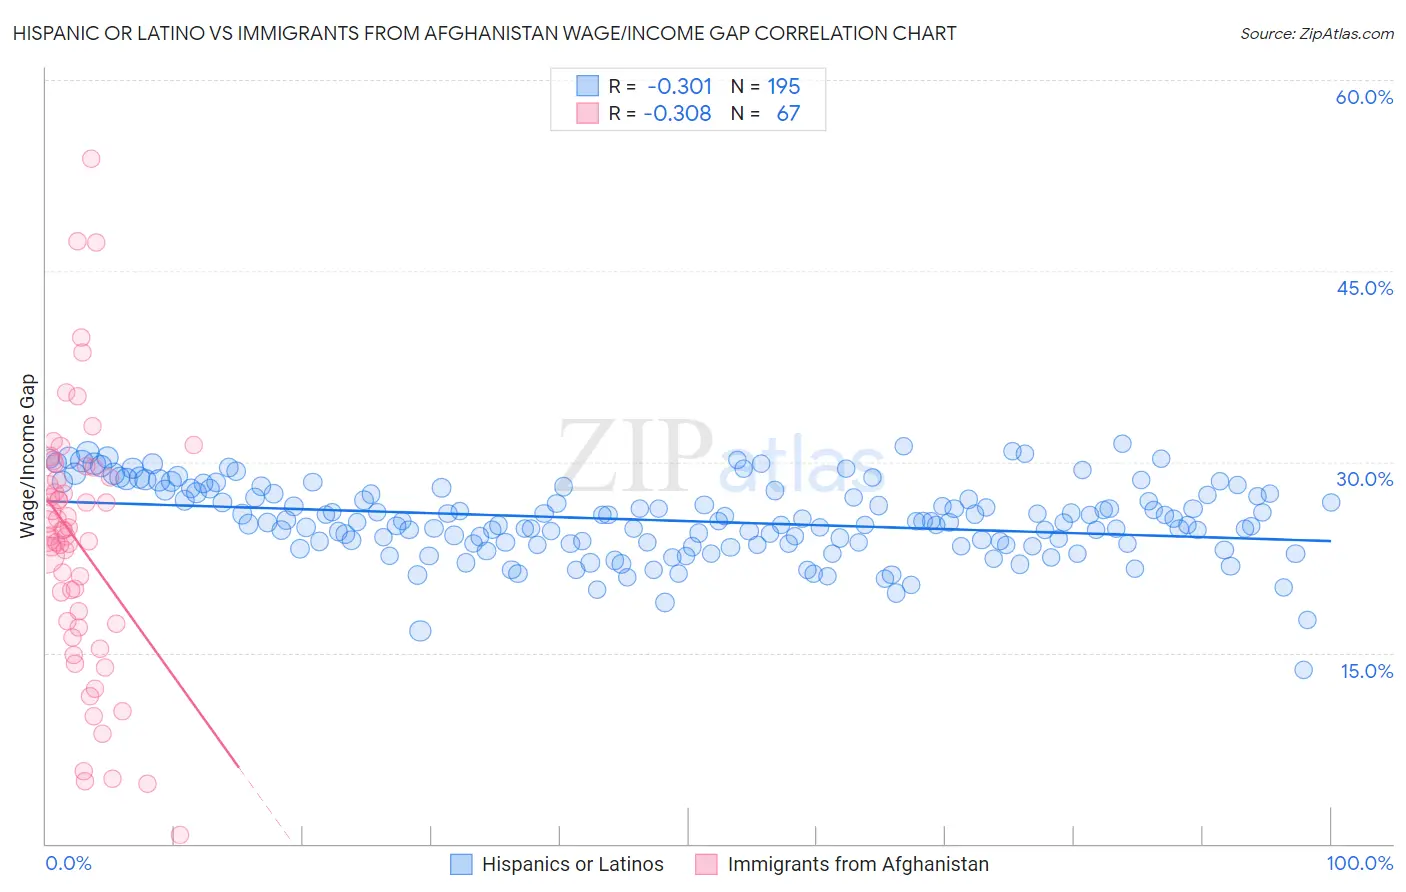
Hispanic or Latino vs Immigrants from Afghanistan Wage/Income Gap Correlation Chart
The statistical analysis conducted on geographies consisting of 570,699,475 people shows a mild negative correlation between the proportion of Hispanics or Latinos and wage/income gap percentage in the United States with a correlation coefficient (R) of -0.301 and weighted average of 24.9%. Similarly, the statistical analysis conducted on geographies consisting of 147,636,341 people shows a mild negative correlation between the proportion of Immigrants from Afghanistan and wage/income gap percentage in the United States with a correlation coefficient (R) of -0.308 and weighted average of 24.4%, a difference of 1.7%.
Wage/Income Gap Correlation Summary
| Measurement | Hispanic or Latino | Immigrants from Afghanistan |
| Minimum | 13.7% | 0.66% |
| Maximum | 31.5% | 53.8% |
| Range | 17.8% | 53.1% |
| Mean | 25.4% | 23.6% |
| Median | 25.3% | 24.1% |
| Interquartile 25% (IQ1) | 23.6% | 17.3% |
| Interquartile 75% (IQ3) | 27.5% | 28.8% |
| Interquartile Range (IQR) | 3.9% | 11.5% |
| Standard Deviation (Sample) | 2.9% | 10.1% |
| Standard Deviation (Population) | 2.9% | 10.1% |
Similar Demographics by Wage/Income Gap
Demographics Similar to Hispanics or Latinos by Wage/Income Gap
In terms of wage/income gap, the demographic groups most similar to Hispanics or Latinos are Immigrants from Nepal (24.9%, a difference of 0.030%), Hawaiian (24.9%, a difference of 0.040%), Immigrants from Bosnia and Herzegovina (24.8%, a difference of 0.11%), Afghan (24.9%, a difference of 0.24%), and Immigrants from Uganda (24.9%, a difference of 0.25%).
| Demographics | Rating | Rank | Wage/Income Gap |
| Immigrants | Costa Rica | 92.4 /100 | #132 | Exceptional 24.7% |
| Colombians | 92.4 /100 | #133 | Exceptional 24.7% |
| Mexican American Indians | 92.2 /100 | #134 | Exceptional 24.7% |
| South American Indians | 92.0 /100 | #135 | Exceptional 24.7% |
| Armenians | 91.3 /100 | #136 | Exceptional 24.8% |
| Immigrants | South Eastern Asia | 90.9 /100 | #137 | Exceptional 24.8% |
| Immigrants | Bosnia and Herzegovina | 90.1 /100 | #138 | Exceptional 24.8% |
| Hispanics or Latinos | 89.5 /100 | #139 | Excellent 24.9% |
| Immigrants | Nepal | 89.3 /100 | #140 | Excellent 24.9% |
| Hawaiians | 89.3 /100 | #141 | Excellent 24.9% |
| Afghans | 88.1 /100 | #142 | Excellent 24.9% |
| Immigrants | Uganda | 88.0 /100 | #143 | Excellent 24.9% |
| Chippewa | 86.9 /100 | #144 | Excellent 25.0% |
| Comanche | 85.2 /100 | #145 | Excellent 25.0% |
| South Americans | 85.2 /100 | #146 | Excellent 25.0% |
Demographics Similar to Immigrants from Afghanistan by Wage/Income Gap
In terms of wage/income gap, the demographic groups most similar to Immigrants from Afghanistan are Immigrants from Micronesia (24.4%, a difference of 0.030%), Kenyan (24.5%, a difference of 0.050%), Alaska Native (24.4%, a difference of 0.060%), Cree (24.5%, a difference of 0.13%), and Immigrants from Kenya (24.4%, a difference of 0.23%).
| Demographics | Rating | Rank | Wage/Income Gap |
| Immigrants | Morocco | 98.1 /100 | #110 | Exceptional 24.1% |
| Soviet Union | 97.6 /100 | #111 | Exceptional 24.2% |
| Immigrants | Colombia | 97.0 /100 | #112 | Exceptional 24.3% |
| Sioux | 96.9 /100 | #113 | Exceptional 24.3% |
| Panamanians | 96.5 /100 | #114 | Exceptional 24.4% |
| Immigrants | Kenya | 96.4 /100 | #115 | Exceptional 24.4% |
| Alaska Natives | 96.0 /100 | #116 | Exceptional 24.4% |
| Immigrants | Afghanistan | 95.9 /100 | #117 | Exceptional 24.4% |
| Immigrants | Micronesia | 95.8 /100 | #118 | Exceptional 24.4% |
| Kenyans | 95.8 /100 | #119 | Exceptional 24.5% |
| Cree | 95.6 /100 | #120 | Exceptional 24.5% |
| Immigrants | Thailand | 94.9 /100 | #121 | Exceptional 24.5% |
| Apache | 94.8 /100 | #122 | Exceptional 24.5% |
| Natives/Alaskans | 94.6 /100 | #123 | Exceptional 24.6% |
| Immigrants | South America | 93.9 /100 | #124 | Exceptional 24.6% |