Paiute vs Subsaharan African Wage/Income Gap
COMPARE
Paiute
Subsaharan African
Wage/Income Gap
Wage/Income Gap Comparison
Paiute
Sub-Saharan Africans
25.5%
WAGE/INCOME GAP
62.9/ 100
METRIC RATING
167th/ 347
METRIC RANK
22.8%
WAGE/INCOME GAP
99.9/ 100
METRIC RATING
72nd/ 347
METRIC RANK
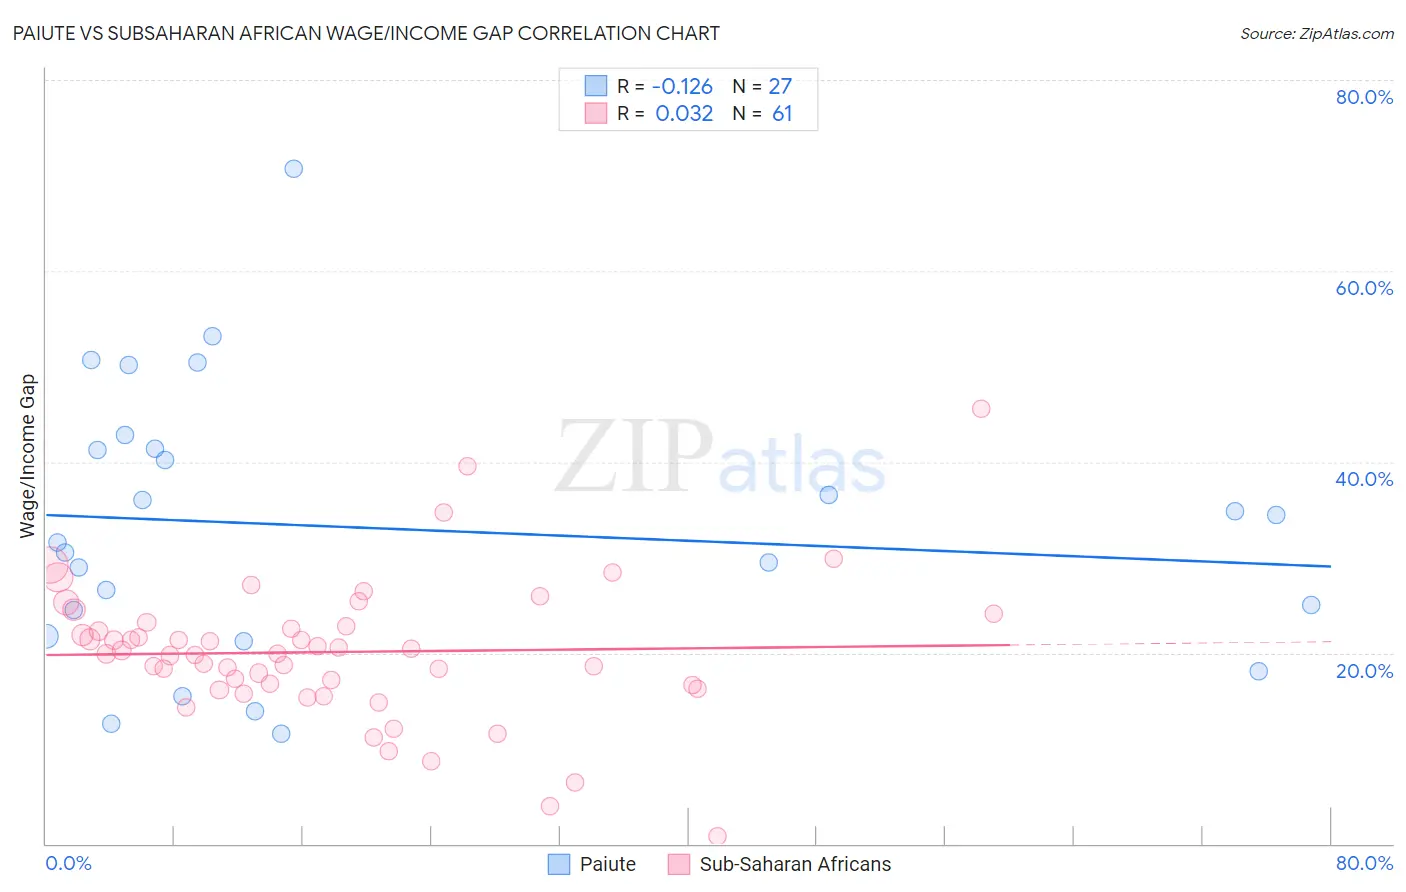
Paiute vs Subsaharan African Wage/Income Gap Correlation Chart
The statistical analysis conducted on geographies consisting of 58,365,830 people shows a poor negative correlation between the proportion of Paiute and wage/income gap percentage in the United States with a correlation coefficient (R) of -0.126 and weighted average of 25.5%. Similarly, the statistical analysis conducted on geographies consisting of 507,315,173 people shows no correlation between the proportion of Sub-Saharan Africans and wage/income gap percentage in the United States with a correlation coefficient (R) of 0.032 and weighted average of 22.8%, a difference of 12.0%.
Wage/Income Gap Correlation Summary
| Measurement | Paiute | Subsaharan African |
| Minimum | 11.5% | 0.79% |
| Maximum | 70.8% | 45.6% |
| Range | 59.2% | 44.8% |
| Mean | 33.1% | 20.1% |
| Median | 31.6% | 19.9% |
| Interquartile 25% (IQ1) | 21.7% | 16.4% |
| Interquartile 75% (IQ3) | 41.4% | 23.0% |
| Interquartile Range (IQR) | 19.6% | 6.6% |
| Standard Deviation (Sample) | 14.3% | 7.4% |
| Standard Deviation (Population) | 14.0% | 7.4% |
Similar Demographics by Wage/Income Gap
Demographics Similar to Paiute by Wage/Income Gap
In terms of wage/income gap, the demographic groups most similar to Paiute are Seminole (25.6%, a difference of 0.020%), Immigrants from Ukraine (25.5%, a difference of 0.060%), Immigrants from Hong Kong (25.5%, a difference of 0.070%), Peruvian (25.6%, a difference of 0.20%), and Immigrants from Oceania (25.6%, a difference of 0.37%).
| Demographics | Rating | Rank | Wage/Income Gap |
| French American Indians | 72.5 /100 | #160 | Good 25.4% |
| Albanians | 69.4 /100 | #161 | Good 25.4% |
| Shoshone | 69.0 /100 | #162 | Good 25.4% |
| Native Hawaiians | 69.0 /100 | #163 | Good 25.4% |
| Koreans | 68.6 /100 | #164 | Good 25.4% |
| Immigrants | Hong Kong | 64.0 /100 | #165 | Good 25.5% |
| Immigrants | Ukraine | 63.8 /100 | #166 | Good 25.5% |
| Paiute | 62.9 /100 | #167 | Good 25.5% |
| Seminole | 62.6 /100 | #168 | Good 25.6% |
| Peruvians | 60.1 /100 | #169 | Good 25.6% |
| Immigrants | Oceania | 57.5 /100 | #170 | Average 25.6% |
| Immigrants | Greece | 56.6 /100 | #171 | Average 25.7% |
| Immigrants | Chile | 53.2 /100 | #172 | Average 25.7% |
| Immigrants | Belarus | 52.9 /100 | #173 | Average 25.7% |
| Alaskan Athabascans | 50.0 /100 | #174 | Average 25.8% |
Demographics Similar to Sub-Saharan Africans by Wage/Income Gap
In terms of wage/income gap, the demographic groups most similar to Sub-Saharan Africans are Immigrants from Eastern Africa (22.8%, a difference of 0.030%), Immigrants from Burma/Myanmar (22.8%, a difference of 0.11%), Immigrants from El Salvador (22.8%, a difference of 0.15%), Immigrants from Uzbekistan (22.7%, a difference of 0.31%), and Fijian (22.9%, a difference of 0.39%).
| Demographics | Rating | Rank | Wage/Income Gap |
| Guatemalans | 99.9 /100 | #65 | Exceptional 22.6% |
| Central American Indians | 99.9 /100 | #66 | Exceptional 22.7% |
| Menominee | 99.9 /100 | #67 | Exceptional 22.7% |
| Immigrants | Nigeria | 99.9 /100 | #68 | Exceptional 22.7% |
| Indonesians | 99.9 /100 | #69 | Exceptional 22.7% |
| Immigrants | Uzbekistan | 99.9 /100 | #70 | Exceptional 22.7% |
| Immigrants | El Salvador | 99.9 /100 | #71 | Exceptional 22.8% |
| Sub-Saharan Africans | 99.9 /100 | #72 | Exceptional 22.8% |
| Immigrants | Eastern Africa | 99.9 /100 | #73 | Exceptional 22.8% |
| Immigrants | Burma/Myanmar | 99.9 /100 | #74 | Exceptional 22.8% |
| Fijians | 99.9 /100 | #75 | Exceptional 22.9% |
| Ecuadorians | 99.9 /100 | #76 | Exceptional 22.9% |
| Africans | 99.9 /100 | #77 | Exceptional 22.9% |
| Nigerians | 99.9 /100 | #78 | Exceptional 23.0% |
| Immigrants | Nicaragua | 99.9 /100 | #79 | Exceptional 23.0% |