White/Caucasian vs Yuman Householder Income Over 65 years
COMPARE
White/Caucasian
Yuman
Householder Income Over 65 years
Householder Income Over 65 years Comparison
Whites/Caucasians
Yuman
$58,847
HOUSEHOLDER INCOME OVER 65 YEARS
9.8/ 100
METRIC RATING
213th/ 347
METRIC RANK
$53,110
HOUSEHOLDER INCOME OVER 65 YEARS
0.0/ 100
METRIC RATING
301st/ 347
METRIC RANK
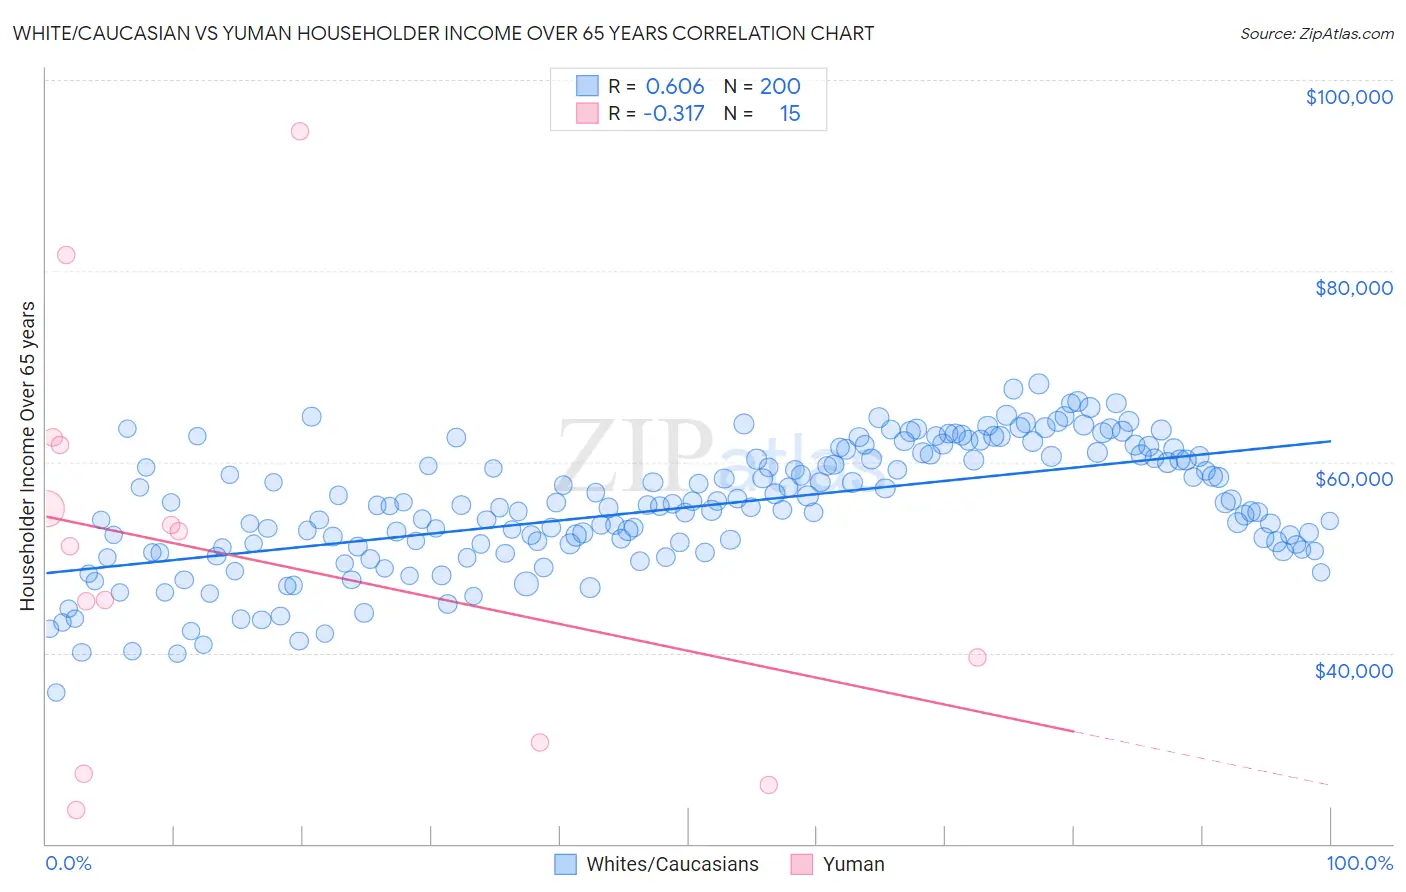
White/Caucasian vs Yuman Householder Income Over 65 years Correlation Chart
The statistical analysis conducted on geographies consisting of 577,509,844 people shows a significant positive correlation between the proportion of Whites/Caucasians and household income with householder over the age of 65 in the United States with a correlation coefficient (R) of 0.606 and weighted average of $58,847. Similarly, the statistical analysis conducted on geographies consisting of 40,575,532 people shows a mild negative correlation between the proportion of Yuman and household income with householder over the age of 65 in the United States with a correlation coefficient (R) of -0.317 and weighted average of $53,110, a difference of 10.8%.
Householder Income Over 65 years Correlation Summary
| Measurement | White/Caucasian | Yuman |
| Minimum | $35,837 | $23,487 |
| Maximum | $68,217 | $94,583 |
| Range | $32,380 | $71,096 |
| Mean | $55,258 | $50,051 |
| Median | $55,418 | $51,214 |
| Interquartile 25% (IQ1) | $51,091 | $30,588 |
| Interquartile 75% (IQ3) | $60,670 | $61,733 |
| Interquartile Range (IQR) | $9,580 | $31,145 |
| Standard Deviation (Sample) | $6,600 | $20,083 |
| Standard Deviation (Population) | $6,583 | $19,402 |
Similar Demographics by Householder Income Over 65 years
Demographics Similar to Whites/Caucasians by Householder Income Over 65 years
In terms of householder income over 65 years, the demographic groups most similar to Whites/Caucasians are Colombian ($58,851, a difference of 0.010%), Nepalese ($58,761, a difference of 0.15%), Immigrants from Nigeria ($58,942, a difference of 0.16%), Nigerian ($58,992, a difference of 0.25%), and Slovak ($59,039, a difference of 0.33%).
| Demographics | Rating | Rank | Householder Income Over 65 years |
| Immigrants | South America | 13.0 /100 | #206 | Poor $59,151 |
| Salvadorans | 12.9 /100 | #207 | Poor $59,141 |
| Uruguayans | 12.3 /100 | #208 | Poor $59,090 |
| Slovaks | 11.7 /100 | #209 | Poor $59,039 |
| Nigerians | 11.2 /100 | #210 | Poor $58,992 |
| Immigrants | Nigeria | 10.7 /100 | #211 | Poor $58,942 |
| Colombians | 9.8 /100 | #212 | Tragic $58,851 |
| Whites/Caucasians | 9.8 /100 | #213 | Tragic $58,847 |
| Nepalese | 9.0 /100 | #214 | Tragic $58,761 |
| Immigrants | Ghana | 7.9 /100 | #215 | Tragic $58,624 |
| Immigrants | Middle Africa | 6.2 /100 | #216 | Tragic $58,375 |
| Sudanese | 5.7 /100 | #217 | Tragic $58,281 |
| Panamanians | 5.6 /100 | #218 | Tragic $58,266 |
| Malaysians | 5.5 /100 | #219 | Tragic $58,244 |
| Yugoslavians | 5.5 /100 | #220 | Tragic $58,243 |
Demographics Similar to Yuman by Householder Income Over 65 years
In terms of householder income over 65 years, the demographic groups most similar to Yuman are Spanish American Indian ($53,077, a difference of 0.060%), Choctaw ($53,060, a difference of 0.090%), Immigrants from Bahamas ($53,174, a difference of 0.12%), Ottawa ($53,217, a difference of 0.20%), and Central American Indian ($53,232, a difference of 0.23%).
| Demographics | Rating | Rank | Householder Income Over 65 years |
| Senegalese | 0.0 /100 | #294 | Tragic $53,591 |
| Immigrants | Central America | 0.0 /100 | #295 | Tragic $53,420 |
| Immigrants | Somalia | 0.0 /100 | #296 | Tragic $53,333 |
| Immigrants | Latin America | 0.0 /100 | #297 | Tragic $53,265 |
| Central American Indians | 0.0 /100 | #298 | Tragic $53,232 |
| Ottawa | 0.0 /100 | #299 | Tragic $53,217 |
| Immigrants | Bahamas | 0.0 /100 | #300 | Tragic $53,174 |
| Yuman | 0.0 /100 | #301 | Tragic $53,110 |
| Spanish American Indians | 0.0 /100 | #302 | Tragic $53,077 |
| Choctaw | 0.0 /100 | #303 | Tragic $53,060 |
| Ute | 0.0 /100 | #304 | Tragic $52,949 |
| Pueblo | 0.0 /100 | #305 | Tragic $52,930 |
| Pennsylvania Germans | 0.0 /100 | #306 | Tragic $52,888 |
| Hispanics or Latinos | 0.0 /100 | #307 | Tragic $52,832 |
| Immigrants | Mexico | 0.0 /100 | #308 | Tragic $52,801 |