Guamanian/Chamorro vs Yuman Householder Income Under 25 years
COMPARE
Guamanian/Chamorro
Yuman
Householder Income Under 25 years
Householder Income Under 25 years Comparison
Guamanians/Chamorros
Yuman
$53,423
HOUSEHOLDER INCOME UNDER 25 YEARS
95.3/ 100
METRIC RATING
120th/ 347
METRIC RANK
$50,933
HOUSEHOLDER INCOME UNDER 25 YEARS
4.4/ 100
METRIC RATING
229th/ 347
METRIC RANK
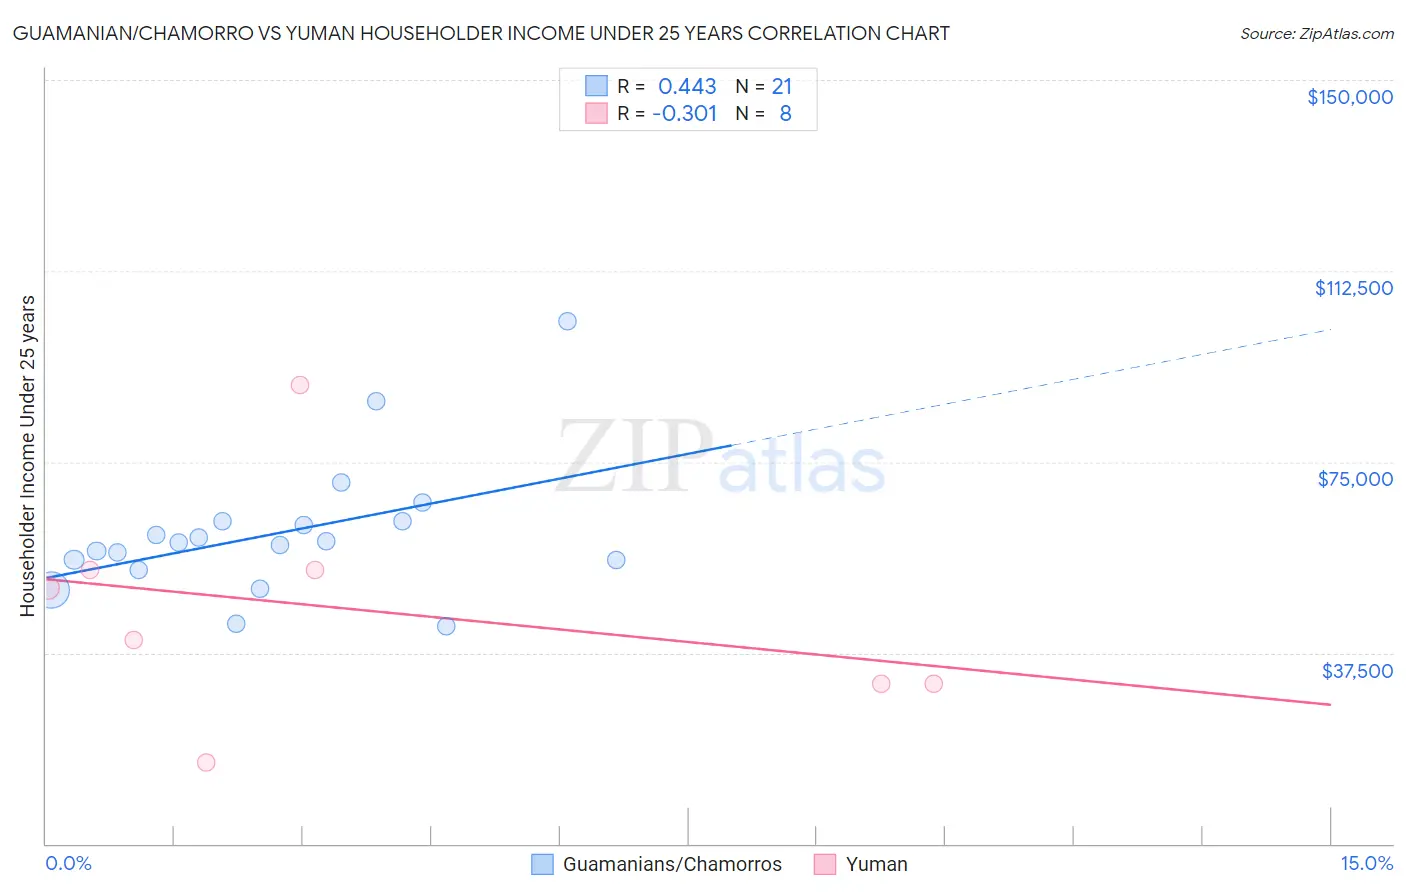
Guamanian/Chamorro vs Yuman Householder Income Under 25 years Correlation Chart
The statistical analysis conducted on geographies consisting of 200,760,858 people shows a moderate positive correlation between the proportion of Guamanians/Chamorros and household income with householder under the age of 25 in the United States with a correlation coefficient (R) of 0.443 and weighted average of $53,423. Similarly, the statistical analysis conducted on geographies consisting of 39,381,315 people shows a mild negative correlation between the proportion of Yuman and household income with householder under the age of 25 in the United States with a correlation coefficient (R) of -0.301 and weighted average of $50,933, a difference of 4.9%.
Householder Income Under 25 years Correlation Summary
| Measurement | Guamanian/Chamorro | Yuman |
| Minimum | $42,829 | $15,893 |
| Maximum | $102,571 | $90,217 |
| Range | $59,742 | $74,324 |
| Mean | $60,959 | $45,866 |
| Median | $59,082 | $45,161 |
| Interquartile 25% (IQ1) | $54,739 | $31,448 |
| Interquartile 75% (IQ3) | $63,324 | $53,802 |
| Interquartile Range (IQR) | $8,585 | $22,354 |
| Standard Deviation (Sample) | $13,387 | $22,232 |
| Standard Deviation (Population) | $13,064 | $20,796 |
Similar Demographics by Householder Income Under 25 years
Demographics Similar to Guamanians/Chamorros by Householder Income Under 25 years
In terms of householder income under 25 years, the demographic groups most similar to Guamanians/Chamorros are Italian ($53,426, a difference of 0.010%), Immigrants from Canada ($53,411, a difference of 0.020%), Immigrants from Ethiopia ($53,408, a difference of 0.030%), Immigrants from Iraq ($53,384, a difference of 0.070%), and Colombian ($53,357, a difference of 0.12%).
| Demographics | Rating | Rank | Householder Income Under 25 years |
| Romanians | 97.2 /100 | #113 | Exceptional $53,632 |
| Immigrants | Sweden | 97.1 /100 | #114 | Exceptional $53,621 |
| Immigrants | Albania | 96.9 /100 | #115 | Exceptional $53,597 |
| Immigrants | Spain | 96.6 /100 | #116 | Exceptional $53,560 |
| Lithuanians | 96.6 /100 | #117 | Exceptional $53,552 |
| Immigrants | Switzerland | 96.3 /100 | #118 | Exceptional $53,528 |
| Italians | 95.4 /100 | #119 | Exceptional $53,426 |
| Guamanians/Chamorros | 95.3 /100 | #120 | Exceptional $53,423 |
| Immigrants | Canada | 95.2 /100 | #121 | Exceptional $53,411 |
| Immigrants | Ethiopia | 95.2 /100 | #122 | Exceptional $53,408 |
| Immigrants | Iraq | 94.9 /100 | #123 | Exceptional $53,384 |
| Colombians | 94.6 /100 | #124 | Exceptional $53,357 |
| Pakistanis | 94.1 /100 | #125 | Exceptional $53,325 |
| Immigrants | Serbia | 94.1 /100 | #126 | Exceptional $53,321 |
| Immigrants | North America | 93.9 /100 | #127 | Exceptional $53,307 |
Demographics Similar to Yuman by Householder Income Under 25 years
In terms of householder income under 25 years, the demographic groups most similar to Yuman are Jamaican ($50,929, a difference of 0.010%), Ugandan ($50,923, a difference of 0.020%), Slovene ($50,886, a difference of 0.090%), Immigrants from Norway ($50,984, a difference of 0.10%), and Pennsylvania German ($50,852, a difference of 0.16%).
| Demographics | Rating | Rank | Householder Income Under 25 years |
| Spaniards | 6.8 /100 | #222 | Tragic $51,117 |
| Serbians | 6.6 /100 | #223 | Tragic $51,106 |
| Belizeans | 6.4 /100 | #224 | Tragic $51,094 |
| Immigrants | Jamaica | 5.6 /100 | #225 | Tragic $51,038 |
| Yugoslavians | 5.5 /100 | #226 | Tragic $51,028 |
| Immigrants | Central America | 5.4 /100 | #227 | Tragic $51,022 |
| Immigrants | Norway | 5.0 /100 | #228 | Tragic $50,984 |
| Yuman | 4.4 /100 | #229 | Tragic $50,933 |
| Jamaicans | 4.4 /100 | #230 | Tragic $50,929 |
| Ugandans | 4.3 /100 | #231 | Tragic $50,923 |
| Slovenes | 4.0 /100 | #232 | Tragic $50,886 |
| Pennsylvania Germans | 3.7 /100 | #233 | Tragic $50,852 |
| Kenyans | 3.3 /100 | #234 | Tragic $50,815 |
| Spanish | 3.3 /100 | #235 | Tragic $50,813 |
| English | 3.3 /100 | #236 | Tragic $50,805 |