Jordanian vs Yuman Householder Income Over 65 years
COMPARE
Jordanian
Yuman
Householder Income Over 65 years
Householder Income Over 65 years Comparison
Jordanians
Yuman
$64,313
HOUSEHOLDER INCOME OVER 65 YEARS
97.1/ 100
METRIC RATING
93rd/ 347
METRIC RANK
$53,110
HOUSEHOLDER INCOME OVER 65 YEARS
0.0/ 100
METRIC RATING
301st/ 347
METRIC RANK
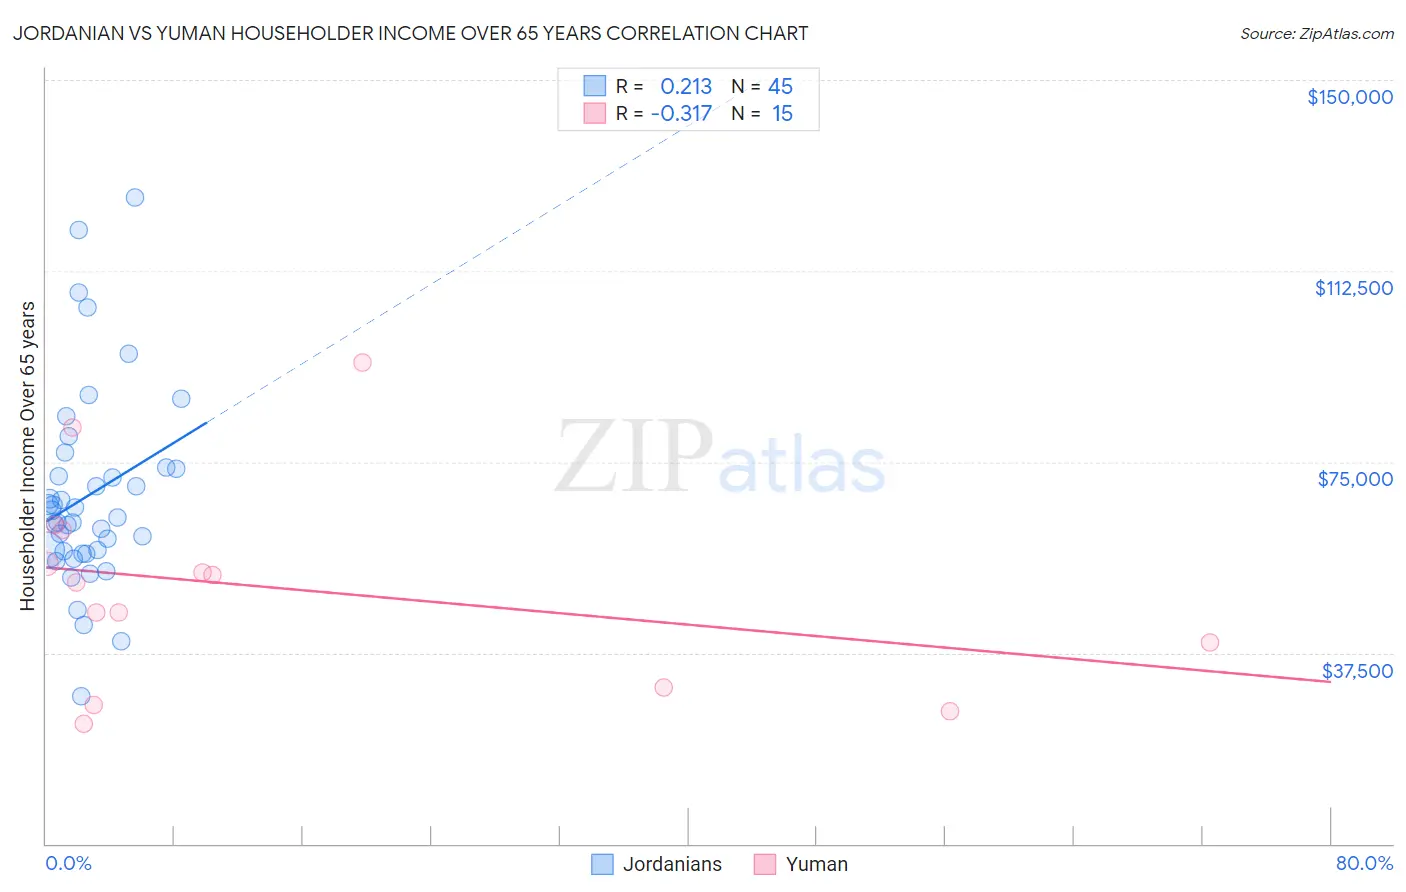
Jordanian vs Yuman Householder Income Over 65 years Correlation Chart
The statistical analysis conducted on geographies consisting of 166,252,116 people shows a weak positive correlation between the proportion of Jordanians and household income with householder over the age of 65 in the United States with a correlation coefficient (R) of 0.213 and weighted average of $64,313. Similarly, the statistical analysis conducted on geographies consisting of 40,575,532 people shows a mild negative correlation between the proportion of Yuman and household income with householder over the age of 65 in the United States with a correlation coefficient (R) of -0.317 and weighted average of $53,110, a difference of 21.1%.
Householder Income Over 65 years Correlation Summary
| Measurement | Jordanian | Yuman |
| Minimum | $29,063 | $23,487 |
| Maximum | $126,912 | $94,583 |
| Range | $97,849 | $71,096 |
| Mean | $68,423 | $50,051 |
| Median | $64,083 | $51,214 |
| Interquartile 25% (IQ1) | $57,185 | $30,588 |
| Interquartile 75% (IQ3) | $73,869 | $61,733 |
| Interquartile Range (IQR) | $16,684 | $31,145 |
| Standard Deviation (Sample) | $19,490 | $20,083 |
| Standard Deviation (Population) | $19,273 | $19,402 |
Similar Demographics by Householder Income Over 65 years
Demographics Similar to Jordanians by Householder Income Over 65 years
In terms of householder income over 65 years, the demographic groups most similar to Jordanians are Immigrants from Egypt ($64,299, a difference of 0.020%), Immigrants from Latvia ($64,298, a difference of 0.020%), Immigrants from Hungary ($64,277, a difference of 0.060%), Immigrants from Bulgaria ($64,379, a difference of 0.10%), and Immigrants from Oceania ($64,416, a difference of 0.16%).
| Demographics | Rating | Rank | Householder Income Over 65 years |
| Immigrants | Russia | 97.6 /100 | #86 | Exceptional $64,512 |
| Austrians | 97.5 /100 | #87 | Exceptional $64,470 |
| Immigrants | Romania | 97.5 /100 | #88 | Exceptional $64,462 |
| Paraguayans | 97.4 /100 | #89 | Exceptional $64,443 |
| Immigrants | Kuwait | 97.4 /100 | #90 | Exceptional $64,433 |
| Immigrants | Oceania | 97.4 /100 | #91 | Exceptional $64,416 |
| Immigrants | Bulgaria | 97.3 /100 | #92 | Exceptional $64,379 |
| Jordanians | 97.1 /100 | #93 | Exceptional $64,313 |
| Immigrants | Egypt | 97.0 /100 | #94 | Exceptional $64,299 |
| Immigrants | Latvia | 97.0 /100 | #95 | Exceptional $64,298 |
| Immigrants | Hungary | 97.0 /100 | #96 | Exceptional $64,277 |
| Sri Lankans | 96.7 /100 | #97 | Exceptional $64,201 |
| Romanians | 96.5 /100 | #98 | Exceptional $64,142 |
| Assyrians/Chaldeans/Syriacs | 96.4 /100 | #99 | Exceptional $64,108 |
| Immigrants | South Eastern Asia | 96.3 /100 | #100 | Exceptional $64,089 |
Demographics Similar to Yuman by Householder Income Over 65 years
In terms of householder income over 65 years, the demographic groups most similar to Yuman are Spanish American Indian ($53,077, a difference of 0.060%), Choctaw ($53,060, a difference of 0.090%), Immigrants from Bahamas ($53,174, a difference of 0.12%), Ottawa ($53,217, a difference of 0.20%), and Central American Indian ($53,232, a difference of 0.23%).
| Demographics | Rating | Rank | Householder Income Over 65 years |
| Senegalese | 0.0 /100 | #294 | Tragic $53,591 |
| Immigrants | Central America | 0.0 /100 | #295 | Tragic $53,420 |
| Immigrants | Somalia | 0.0 /100 | #296 | Tragic $53,333 |
| Immigrants | Latin America | 0.0 /100 | #297 | Tragic $53,265 |
| Central American Indians | 0.0 /100 | #298 | Tragic $53,232 |
| Ottawa | 0.0 /100 | #299 | Tragic $53,217 |
| Immigrants | Bahamas | 0.0 /100 | #300 | Tragic $53,174 |
| Yuman | 0.0 /100 | #301 | Tragic $53,110 |
| Spanish American Indians | 0.0 /100 | #302 | Tragic $53,077 |
| Choctaw | 0.0 /100 | #303 | Tragic $53,060 |
| Ute | 0.0 /100 | #304 | Tragic $52,949 |
| Pueblo | 0.0 /100 | #305 | Tragic $52,930 |
| Pennsylvania Germans | 0.0 /100 | #306 | Tragic $52,888 |
| Hispanics or Latinos | 0.0 /100 | #307 | Tragic $52,832 |
| Immigrants | Mexico | 0.0 /100 | #308 | Tragic $52,801 |