Immigrants from Eastern Africa vs Yuman Householder Income Over 65 years
COMPARE
Immigrants from Eastern Africa
Yuman
Householder Income Over 65 years
Householder Income Over 65 years Comparison
Immigrants from Eastern Africa
Yuman
$61,157
HOUSEHOLDER INCOME OVER 65 YEARS
55.0/ 100
METRIC RATING
166th/ 347
METRIC RANK
$53,110
HOUSEHOLDER INCOME OVER 65 YEARS
0.0/ 100
METRIC RATING
301st/ 347
METRIC RANK
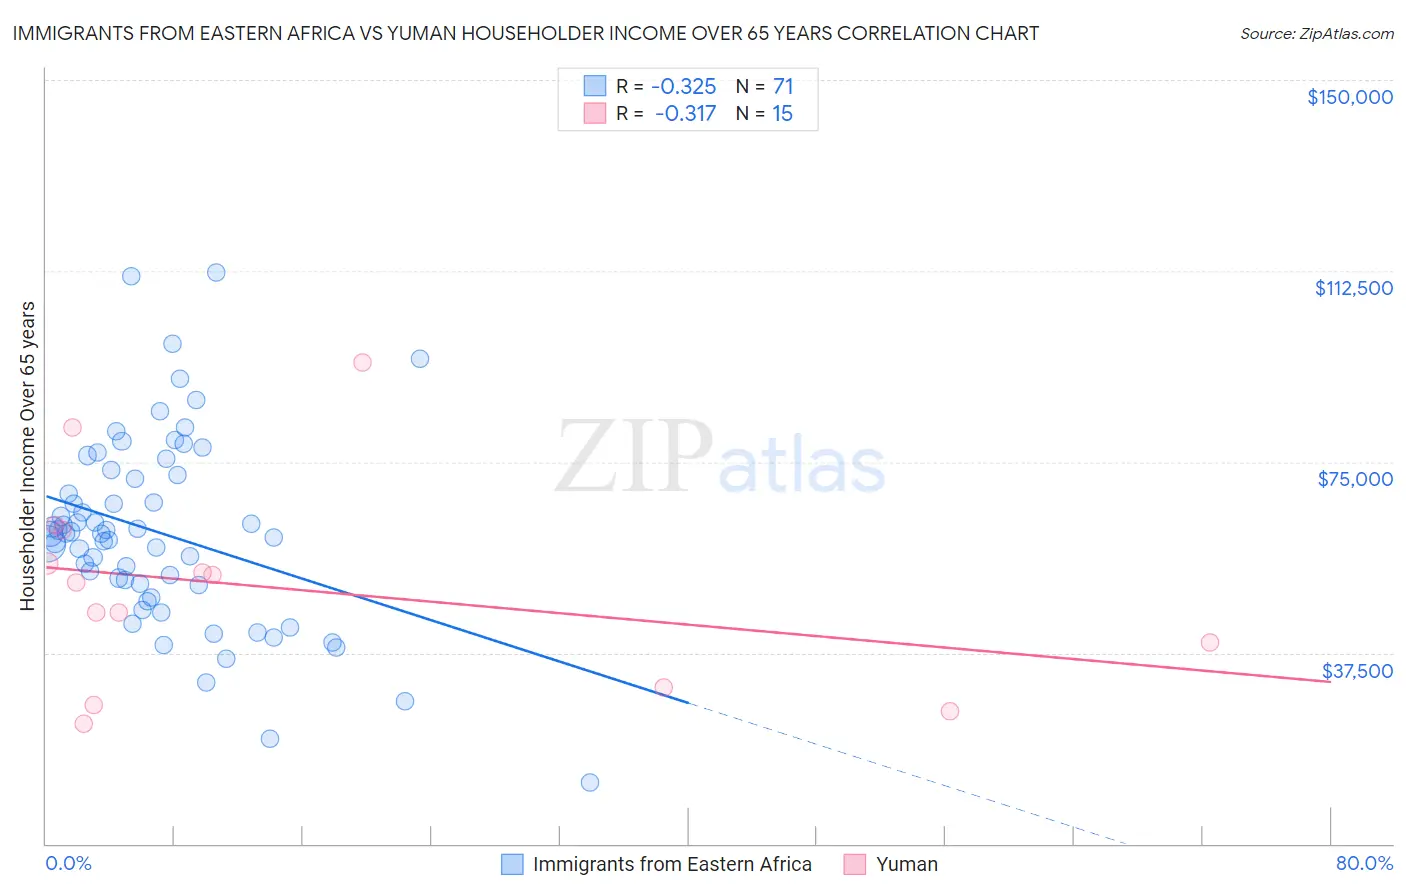
Immigrants from Eastern Africa vs Yuman Householder Income Over 65 years Correlation Chart
The statistical analysis conducted on geographies consisting of 354,024,909 people shows a mild negative correlation between the proportion of Immigrants from Eastern Africa and household income with householder over the age of 65 in the United States with a correlation coefficient (R) of -0.325 and weighted average of $61,157. Similarly, the statistical analysis conducted on geographies consisting of 40,575,532 people shows a mild negative correlation between the proportion of Yuman and household income with householder over the age of 65 in the United States with a correlation coefficient (R) of -0.317 and weighted average of $53,110, a difference of 15.1%.
Householder Income Over 65 years Correlation Summary
| Measurement | Immigrants from Eastern Africa | Yuman |
| Minimum | $12,049 | $23,487 |
| Maximum | $112,225 | $94,583 |
| Range | $100,176 | $71,096 |
| Mean | $61,052 | $50,051 |
| Median | $60,948 | $51,214 |
| Interquartile 25% (IQ1) | $50,731 | $30,588 |
| Interquartile 75% (IQ3) | $72,534 | $61,733 |
| Interquartile Range (IQR) | $21,803 | $31,145 |
| Standard Deviation (Sample) | $18,747 | $20,083 |
| Standard Deviation (Population) | $18,615 | $19,402 |
Similar Demographics by Householder Income Over 65 years
Demographics Similar to Immigrants from Eastern Africa by Householder Income Over 65 years
In terms of householder income over 65 years, the demographic groups most similar to Immigrants from Eastern Africa are Immigrants from Ukraine ($61,163, a difference of 0.010%), Ugandan ($61,177, a difference of 0.030%), Immigrants from North Macedonia ($61,175, a difference of 0.030%), Norwegian ($61,104, a difference of 0.090%), and Irish ($61,097, a difference of 0.10%).
| Demographics | Rating | Rank | Householder Income Over 65 years |
| Brazilians | 62.7 /100 | #159 | Good $61,465 |
| Portuguese | 62.1 /100 | #160 | Good $61,440 |
| Icelanders | 57.9 /100 | #161 | Average $61,270 |
| Czechs | 57.2 /100 | #162 | Average $61,244 |
| Ugandans | 55.5 /100 | #163 | Average $61,177 |
| Immigrants | North Macedonia | 55.4 /100 | #164 | Average $61,175 |
| Immigrants | Ukraine | 55.1 /100 | #165 | Average $61,163 |
| Immigrants | Eastern Africa | 55.0 /100 | #166 | Average $61,157 |
| Norwegians | 53.6 /100 | #167 | Average $61,104 |
| Irish | 53.4 /100 | #168 | Average $61,097 |
| Carpatho Rusyns | 53.3 /100 | #169 | Average $61,093 |
| Serbians | 53.1 /100 | #170 | Average $61,087 |
| Inupiat | 52.4 /100 | #171 | Average $61,061 |
| Immigrants | Poland | 51.9 /100 | #172 | Average $61,041 |
| Immigrants | Micronesia | 50.8 /100 | #173 | Average $61,000 |
Demographics Similar to Yuman by Householder Income Over 65 years
In terms of householder income over 65 years, the demographic groups most similar to Yuman are Spanish American Indian ($53,077, a difference of 0.060%), Choctaw ($53,060, a difference of 0.090%), Immigrants from Bahamas ($53,174, a difference of 0.12%), Ottawa ($53,217, a difference of 0.20%), and Central American Indian ($53,232, a difference of 0.23%).
| Demographics | Rating | Rank | Householder Income Over 65 years |
| Senegalese | 0.0 /100 | #294 | Tragic $53,591 |
| Immigrants | Central America | 0.0 /100 | #295 | Tragic $53,420 |
| Immigrants | Somalia | 0.0 /100 | #296 | Tragic $53,333 |
| Immigrants | Latin America | 0.0 /100 | #297 | Tragic $53,265 |
| Central American Indians | 0.0 /100 | #298 | Tragic $53,232 |
| Ottawa | 0.0 /100 | #299 | Tragic $53,217 |
| Immigrants | Bahamas | 0.0 /100 | #300 | Tragic $53,174 |
| Yuman | 0.0 /100 | #301 | Tragic $53,110 |
| Spanish American Indians | 0.0 /100 | #302 | Tragic $53,077 |
| Choctaw | 0.0 /100 | #303 | Tragic $53,060 |
| Ute | 0.0 /100 | #304 | Tragic $52,949 |
| Pueblo | 0.0 /100 | #305 | Tragic $52,930 |
| Pennsylvania Germans | 0.0 /100 | #306 | Tragic $52,888 |
| Hispanics or Latinos | 0.0 /100 | #307 | Tragic $52,832 |
| Immigrants | Mexico | 0.0 /100 | #308 | Tragic $52,801 |