Cherokee vs Blackfeet Householder Income Over 65 years
COMPARE
Cherokee
Blackfeet
Householder Income Over 65 years
Householder Income Over 65 years Comparison
Cherokee
Blackfeet
$54,133
HOUSEHOLDER INCOME OVER 65 YEARS
0.1/ 100
METRIC RATING
275th/ 347
METRIC RANK
$54,029
HOUSEHOLDER INCOME OVER 65 YEARS
0.1/ 100
METRIC RATING
279th/ 347
METRIC RANK
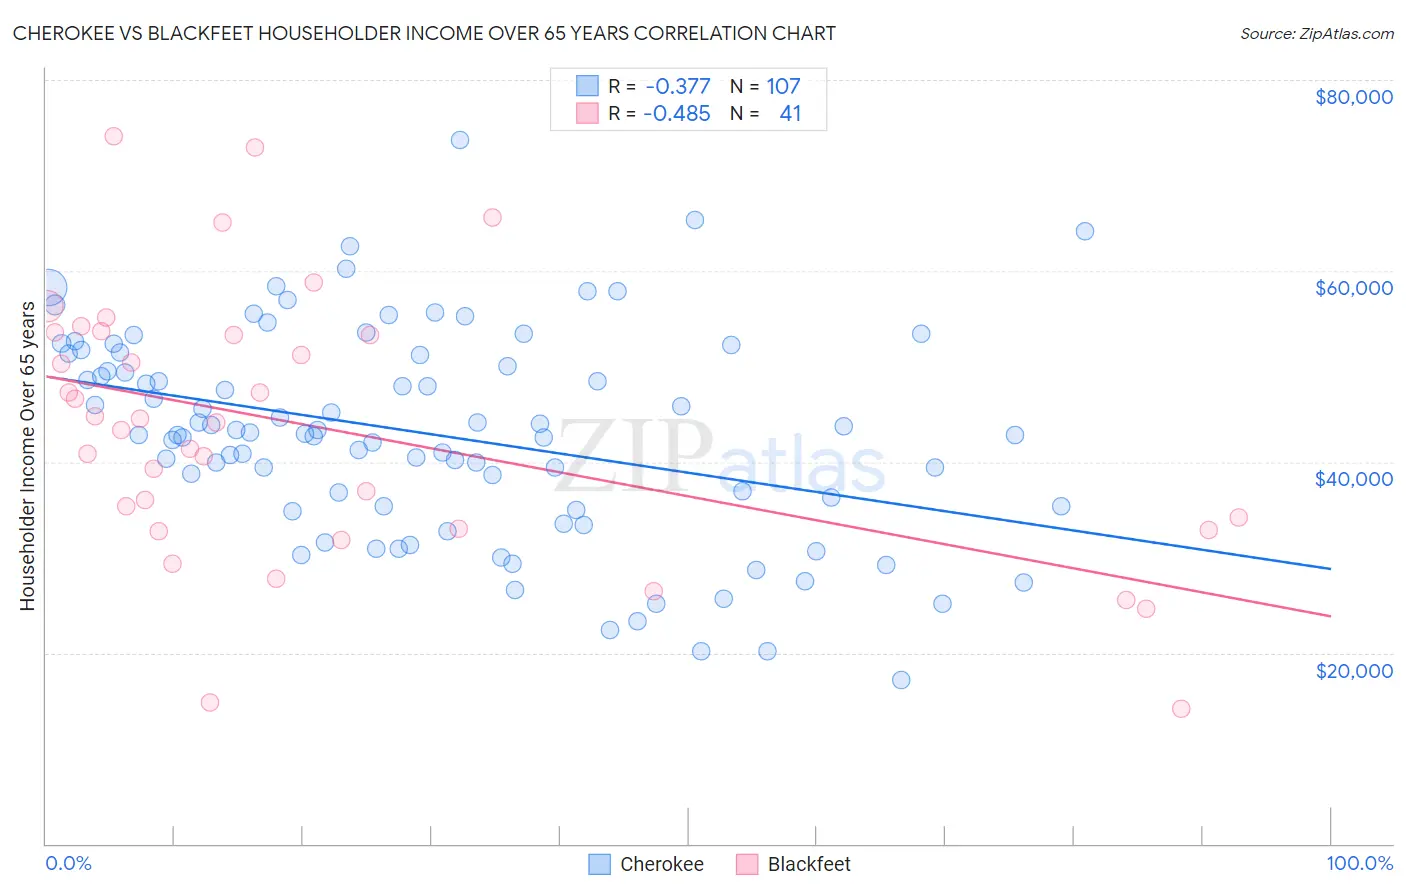
Cherokee vs Blackfeet Householder Income Over 65 years Correlation Chart
The statistical analysis conducted on geographies consisting of 490,908,183 people shows a mild negative correlation between the proportion of Cherokee and household income with householder over the age of 65 in the United States with a correlation coefficient (R) of -0.377 and weighted average of $54,133. Similarly, the statistical analysis conducted on geographies consisting of 308,657,896 people shows a moderate negative correlation between the proportion of Blackfeet and household income with householder over the age of 65 in the United States with a correlation coefficient (R) of -0.485 and weighted average of $54,029, a difference of 0.19%.
Householder Income Over 65 years Correlation Summary
| Measurement | Cherokee | Blackfeet |
| Minimum | $17,188 | $14,196 |
| Maximum | $73,750 | $74,087 |
| Range | $56,562 | $59,891 |
| Mean | $42,917 | $43,504 |
| Median | $42,899 | $44,167 |
| Interquartile 25% (IQ1) | $35,369 | $32,958 |
| Interquartile 75% (IQ3) | $51,355 | $53,466 |
| Interquartile Range (IQR) | $15,986 | $20,508 |
| Standard Deviation (Sample) | $10,957 | $14,024 |
| Standard Deviation (Population) | $10,906 | $13,852 |
Demographics Similar to Cherokee and Blackfeet by Householder Income Over 65 years
In terms of householder income over 65 years, the demographic groups most similar to Cherokee are Cree ($54,129, a difference of 0.010%), Barbadian ($54,163, a difference of 0.060%), Cheyenne ($54,096, a difference of 0.070%), Indonesian ($54,176, a difference of 0.080%), and Potawatomi ($54,212, a difference of 0.15%). Similarly, the demographic groups most similar to Blackfeet are Immigrants from Ecuador ($54,030, a difference of 0.0%), Immigrants from Jamaica ($54,027, a difference of 0.0%), Somali ($54,004, a difference of 0.050%), Immigrants from Armenia ($53,974, a difference of 0.10%), and Cheyenne ($54,096, a difference of 0.12%).
| Demographics | Rating | Rank | Householder Income Over 65 years |
| Guatemalans | 0.1 /100 | #267 | Tragic $54,526 |
| Immigrants | Zaire | 0.1 /100 | #268 | Tragic $54,512 |
| Nicaraguans | 0.1 /100 | #269 | Tragic $54,474 |
| Immigrants | Senegal | 0.1 /100 | #270 | Tragic $54,447 |
| Liberians | 0.1 /100 | #271 | Tragic $54,356 |
| Potawatomi | 0.1 /100 | #272 | Tragic $54,212 |
| Indonesians | 0.1 /100 | #273 | Tragic $54,176 |
| Barbadians | 0.1 /100 | #274 | Tragic $54,163 |
| Cherokee | 0.1 /100 | #275 | Tragic $54,133 |
| Cree | 0.1 /100 | #276 | Tragic $54,129 |
| Cheyenne | 0.1 /100 | #277 | Tragic $54,096 |
| Immigrants | Ecuador | 0.1 /100 | #278 | Tragic $54,030 |
| Blackfeet | 0.1 /100 | #279 | Tragic $54,029 |
| Immigrants | Jamaica | 0.1 /100 | #280 | Tragic $54,027 |
| Somalis | 0.1 /100 | #281 | Tragic $54,004 |
| Immigrants | Armenia | 0.1 /100 | #282 | Tragic $53,974 |
| Immigrants | Liberia | 0.1 /100 | #283 | Tragic $53,967 |
| Immigrants | Guatemala | 0.1 /100 | #284 | Tragic $53,950 |
| Mexicans | 0.1 /100 | #285 | Tragic $53,897 |
| Chippewa | 0.1 /100 | #286 | Tragic $53,847 |
| Immigrants | Barbados | 0.1 /100 | #287 | Tragic $53,766 |