Guamanian/Chamorro vs Blackfeet Unemployment Among Seniors over 65 years
COMPARE
Guamanian/Chamorro
Blackfeet
Unemployment Among Seniors over 65 years
Unemployment Among Seniors over 65 years Comparison
Guamanians/Chamorros
Blackfeet
5.2%
UNEMPLOYMENT AMONG SENIORS OVER 65 YEARS
22.5/ 100
METRIC RATING
197th/ 347
METRIC RANK
5.3%
UNEMPLOYMENT AMONG SENIORS OVER 65 YEARS
3.1/ 100
METRIC RATING
234th/ 347
METRIC RANK
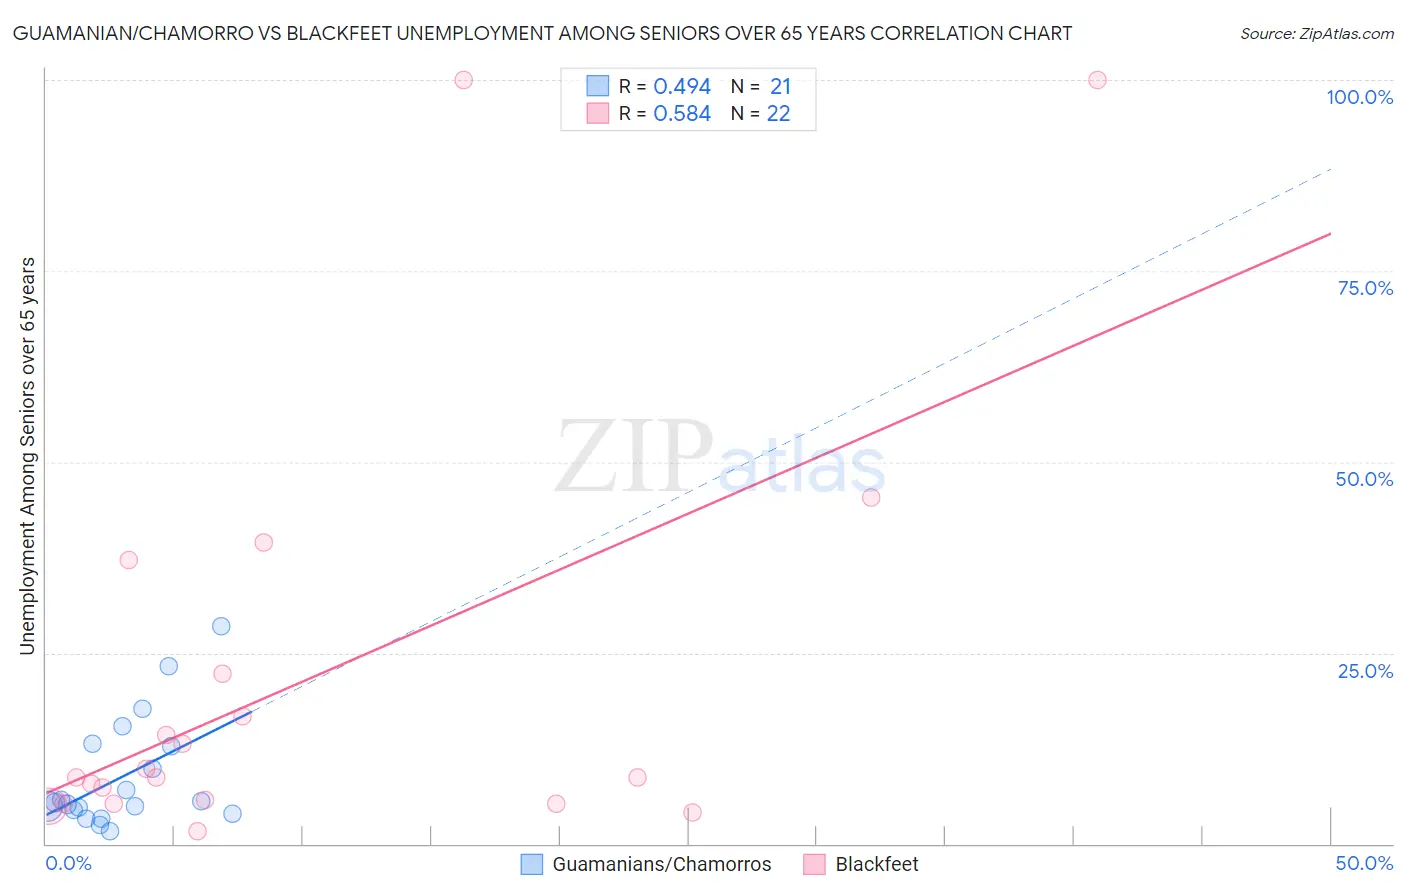
Guamanian/Chamorro vs Blackfeet Unemployment Among Seniors over 65 years Correlation Chart
The statistical analysis conducted on geographies consisting of 208,240,219 people shows a moderate positive correlation between the proportion of Guamanians/Chamorros and unemployment rate amomg seniors over the age of 65 in the United States with a correlation coefficient (R) of 0.494 and weighted average of 5.2%. Similarly, the statistical analysis conducted on geographies consisting of 279,008,819 people shows a substantial positive correlation between the proportion of Blackfeet and unemployment rate amomg seniors over the age of 65 in the United States with a correlation coefficient (R) of 0.584 and weighted average of 5.3%, a difference of 1.8%.
Unemployment Among Seniors over 65 years Correlation Summary
| Measurement | Guamanian/Chamorro | Blackfeet |
| Minimum | 1.7% | 1.6% |
| Maximum | 28.5% | 100.0% |
| Range | 26.8% | 98.4% |
| Mean | 8.7% | 21.4% |
| Median | 5.5% | 8.7% |
| Interquartile 25% (IQ1) | 4.2% | 5.2% |
| Interquartile 75% (IQ3) | 12.9% | 22.3% |
| Interquartile Range (IQR) | 8.8% | 17.1% |
| Standard Deviation (Sample) | 7.2% | 28.2% |
| Standard Deviation (Population) | 7.0% | 27.5% |
Similar Demographics by Unemployment Among Seniors over 65 years
Demographics Similar to Guamanians/Chamorros by Unemployment Among Seniors over 65 years
In terms of unemployment among seniors over 65 years, the demographic groups most similar to Guamanians/Chamorros are Immigrants from Poland (5.2%, a difference of 0.080%), Maltese (5.2%, a difference of 0.14%), Immigrants from Europe (5.2%, a difference of 0.17%), Costa Rican (5.2%, a difference of 0.19%), and Immigrants from Pakistan (5.2%, a difference of 0.20%).
| Demographics | Rating | Rank | Unemployment Among Seniors over 65 years |
| Koreans | 31.6 /100 | #190 | Fair 5.2% |
| Immigrants | Denmark | 31.0 /100 | #191 | Fair 5.2% |
| Sioux | 30.8 /100 | #192 | Fair 5.2% |
| Immigrants | Africa | 29.6 /100 | #193 | Fair 5.2% |
| Argentineans | 29.1 /100 | #194 | Fair 5.2% |
| Costa Ricans | 27.0 /100 | #195 | Fair 5.2% |
| Immigrants | Poland | 24.3 /100 | #196 | Fair 5.2% |
| Guamanians/Chamorros | 22.5 /100 | #197 | Fair 5.2% |
| Maltese | 19.6 /100 | #198 | Poor 5.2% |
| Immigrants | Europe | 19.0 /100 | #199 | Poor 5.2% |
| Immigrants | Pakistan | 18.4 /100 | #200 | Poor 5.2% |
| Laotians | 18.1 /100 | #201 | Poor 5.2% |
| Immigrants | Northern Africa | 17.7 /100 | #202 | Poor 5.2% |
| Sub-Saharan Africans | 17.1 /100 | #203 | Poor 5.2% |
| Immigrants | China | 16.9 /100 | #204 | Poor 5.2% |
Demographics Similar to Blackfeet by Unemployment Among Seniors over 65 years
In terms of unemployment among seniors over 65 years, the demographic groups most similar to Blackfeet are Marshallese (5.3%, a difference of 0.0%), Hopi (5.3%, a difference of 0.090%), Immigrants from Albania (5.3%, a difference of 0.10%), Hungarian (5.3%, a difference of 0.18%), and Immigrants from Argentina (5.3%, a difference of 0.20%).
| Demographics | Rating | Rank | Unemployment Among Seniors over 65 years |
| French American Indians | 5.2 /100 | #227 | Tragic 5.3% |
| Haitians | 4.4 /100 | #228 | Tragic 5.3% |
| Samoans | 4.2 /100 | #229 | Tragic 5.3% |
| Immigrants | Argentina | 4.0 /100 | #230 | Tragic 5.3% |
| Hungarians | 3.9 /100 | #231 | Tragic 5.3% |
| Hopi | 3.5 /100 | #232 | Tragic 5.3% |
| Marshallese | 3.1 /100 | #233 | Tragic 5.3% |
| Blackfeet | 3.1 /100 | #234 | Tragic 5.3% |
| Immigrants | Albania | 2.7 /100 | #235 | Tragic 5.3% |
| Immigrants | Costa Rica | 2.1 /100 | #236 | Tragic 5.3% |
| Immigrants | Greece | 2.0 /100 | #237 | Tragic 5.3% |
| Immigrants | Israel | 2.0 /100 | #238 | Tragic 5.3% |
| Immigrants | Senegal | 1.8 /100 | #239 | Tragic 5.3% |
| Immigrants | Trinidad and Tobago | 1.6 /100 | #240 | Tragic 5.3% |
| Apache | 1.3 /100 | #241 | Tragic 5.3% |