Guamanian/Chamorro vs Blackfeet Unemployment Among Ages 60 to 64 years
COMPARE
Guamanian/Chamorro
Blackfeet
Unemployment Among Ages 60 to 64 years
Unemployment Among Ages 60 to 64 years Comparison
Guamanians/Chamorros
Blackfeet
4.9%
UNEMPLOYMENT AMONG AGES 60 TO 64 YEARS
23.7/ 100
METRIC RATING
198th/ 347
METRIC RANK
4.9%
UNEMPLOYMENT AMONG AGES 60 TO 64 YEARS
15.7/ 100
METRIC RATING
211th/ 347
METRIC RANK
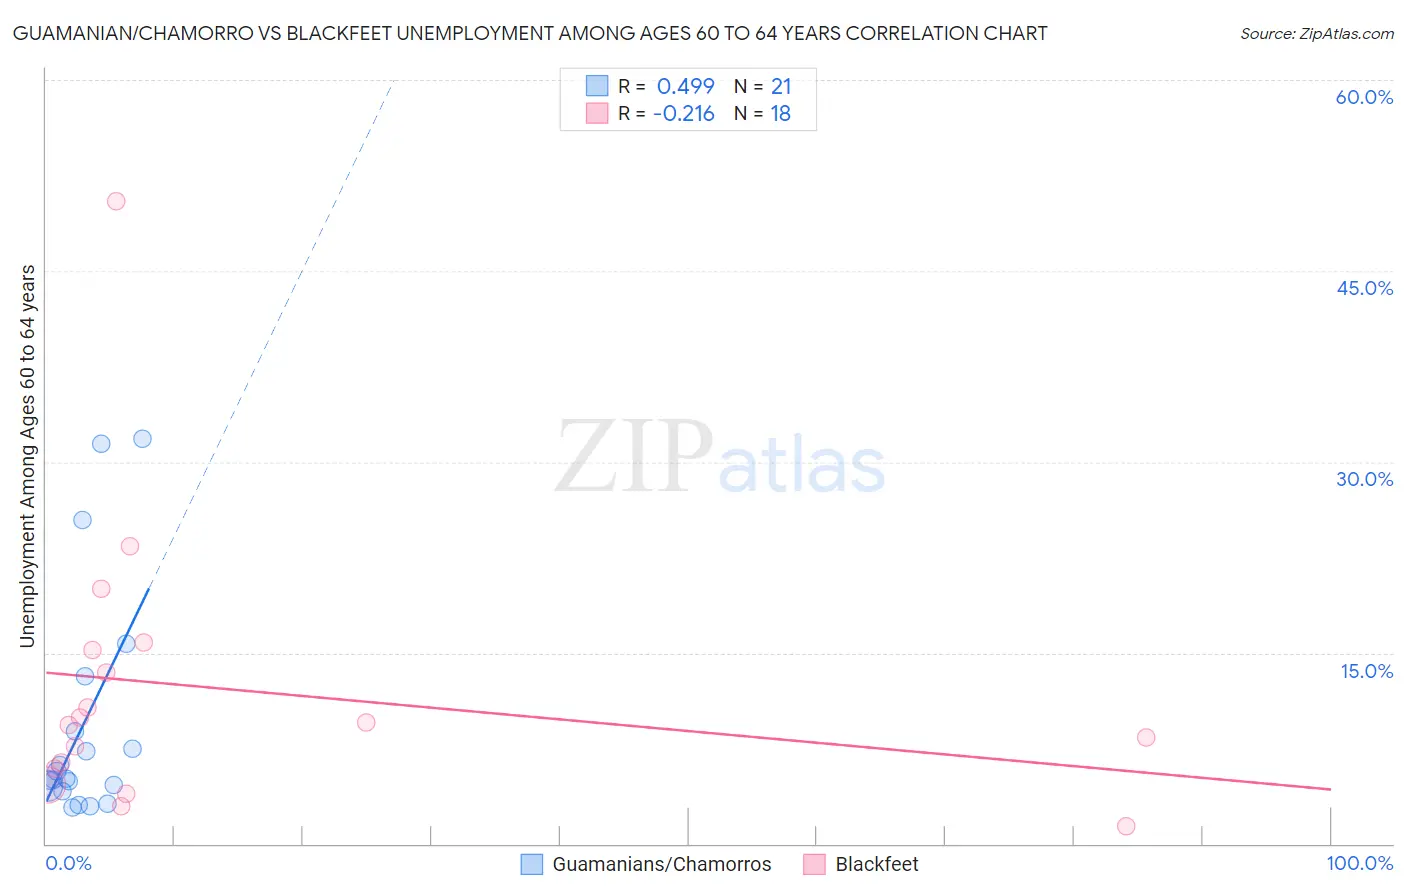
Guamanian/Chamorro vs Blackfeet Unemployment Among Ages 60 to 64 years Correlation Chart
The statistical analysis conducted on geographies consisting of 209,235,205 people shows a moderate positive correlation between the proportion of Guamanians/Chamorros and unemployment rate among population between the ages 60 and 64 in the United States with a correlation coefficient (R) of 0.499 and weighted average of 4.9%. Similarly, the statistical analysis conducted on geographies consisting of 280,375,878 people shows a weak negative correlation between the proportion of Blackfeet and unemployment rate among population between the ages 60 and 64 in the United States with a correlation coefficient (R) of -0.216 and weighted average of 4.9%, a difference of 0.45%.
Unemployment Among Ages 60 to 64 years Correlation Summary
| Measurement | Guamanian/Chamorro | Blackfeet |
| Minimum | 2.8% | 1.4% |
| Maximum | 31.8% | 50.5% |
| Range | 29.0% | 49.1% |
| Mean | 9.4% | 12.2% |
| Median | 5.1% | 9.4% |
| Interquartile 25% (IQ1) | 4.3% | 5.9% |
| Interquartile 75% (IQ3) | 11.0% | 15.3% |
| Interquartile Range (IQR) | 6.6% | 9.4% |
| Standard Deviation (Sample) | 9.1% | 11.2% |
| Standard Deviation (Population) | 8.8% | 10.9% |
Demographics Similar to Guamanians/Chamorros and Blackfeet by Unemployment Among Ages 60 to 64 years
In terms of unemployment among ages 60 to 64 years, the demographic groups most similar to Guamanians/Chamorros are Immigrants from Vietnam (4.9%, a difference of 0.0%), Immigrants from Czechoslovakia (4.9%, a difference of 0.010%), Colombian (4.9%, a difference of 0.050%), Immigrants from Eastern Europe (4.9%, a difference of 0.070%), and Immigrants from Asia (4.9%, a difference of 0.090%). Similarly, the demographic groups most similar to Blackfeet are Cherokee (4.9%, a difference of 0.030%), Sierra Leonean (4.9%, a difference of 0.050%), Moroccan (4.9%, a difference of 0.050%), German Russian (4.9%, a difference of 0.070%), and Eastern European (4.9%, a difference of 0.090%).
| Demographics | Rating | Rank | Unemployment Among Ages 60 to 64 years |
| Immigrants | Colombia | 26.8 /100 | #194 | Fair 4.9% |
| Immigrants | Austria | 26.6 /100 | #195 | Fair 4.9% |
| Immigrants | Asia | 25.7 /100 | #196 | Fair 4.9% |
| Immigrants | Eastern Europe | 25.2 /100 | #197 | Fair 4.9% |
| Guamanians/Chamorros | 23.7 /100 | #198 | Fair 4.9% |
| Immigrants | Vietnam | 23.7 /100 | #199 | Fair 4.9% |
| Immigrants | Czechoslovakia | 23.5 /100 | #200 | Fair 4.9% |
| Colombians | 22.7 /100 | #201 | Fair 4.9% |
| Immigrants | Western Africa | 20.6 /100 | #202 | Fair 4.9% |
| Uruguayans | 19.9 /100 | #203 | Poor 4.9% |
| Russians | 18.9 /100 | #204 | Poor 4.9% |
| Immigrants | Indonesia | 17.4 /100 | #205 | Poor 4.9% |
| New Zealanders | 17.4 /100 | #206 | Poor 4.9% |
| Chippewa | 17.3 /100 | #207 | Poor 4.9% |
| German Russians | 16.8 /100 | #208 | Poor 4.9% |
| Sierra Leoneans | 16.5 /100 | #209 | Poor 4.9% |
| Cherokee | 16.1 /100 | #210 | Poor 4.9% |
| Blackfeet | 15.7 /100 | #211 | Poor 4.9% |
| Moroccans | 15.0 /100 | #212 | Poor 4.9% |
| Eastern Europeans | 14.3 /100 | #213 | Poor 4.9% |
| Immigrants | Russia | 13.7 /100 | #214 | Poor 4.9% |