Native/Alaskan vs Blackfeet Householder Income Over 65 years
COMPARE
Native/Alaskan
Blackfeet
Householder Income Over 65 years
Householder Income Over 65 years Comparison
Natives/Alaskans
Blackfeet
$52,081
HOUSEHOLDER INCOME OVER 65 YEARS
0.0/ 100
METRIC RATING
314th/ 347
METRIC RANK
$54,029
HOUSEHOLDER INCOME OVER 65 YEARS
0.1/ 100
METRIC RATING
279th/ 347
METRIC RANK
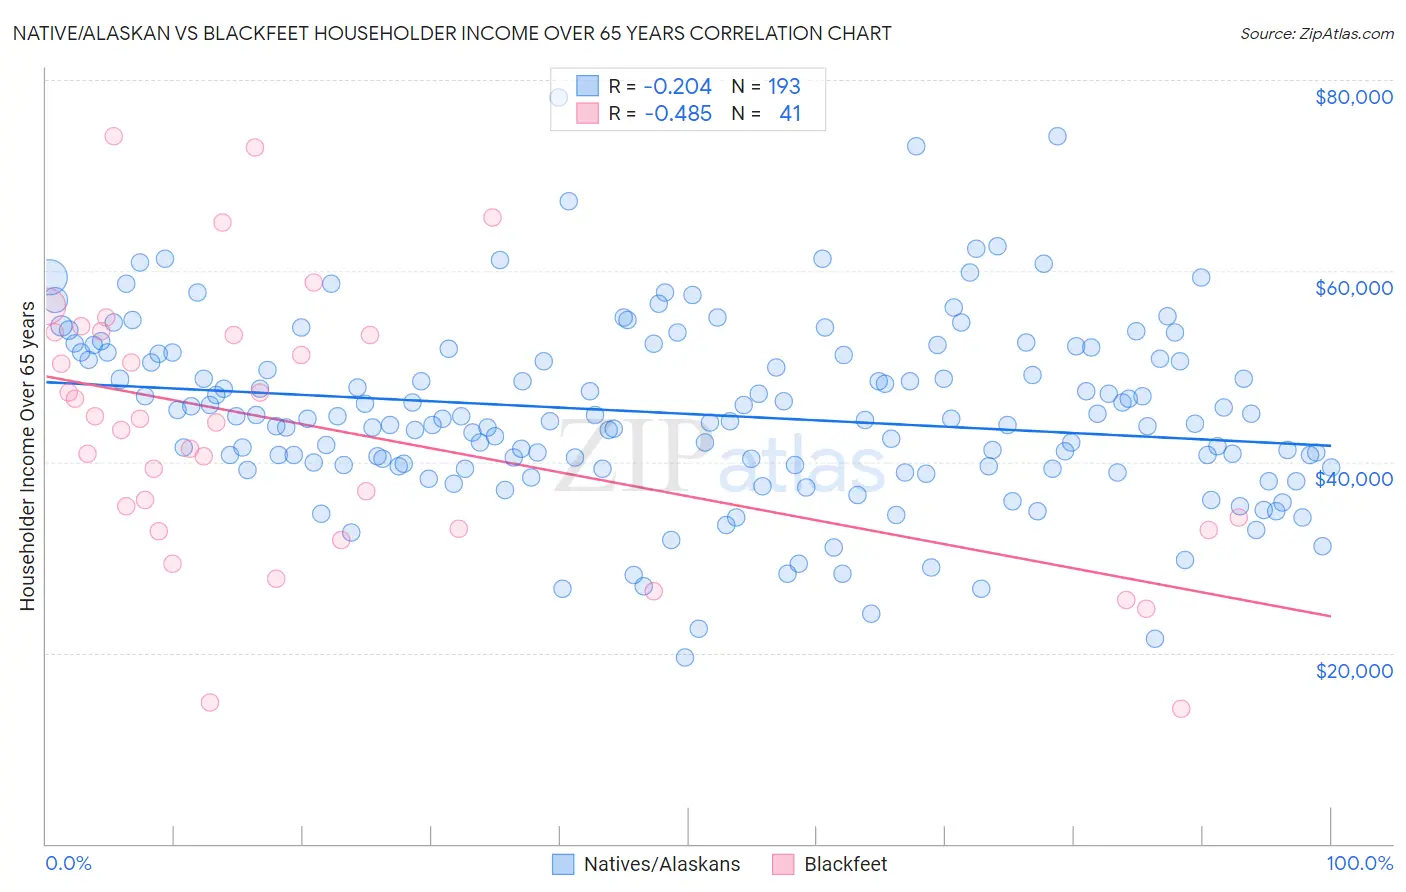
Native/Alaskan vs Blackfeet Householder Income Over 65 years Correlation Chart
The statistical analysis conducted on geographies consisting of 509,572,105 people shows a weak negative correlation between the proportion of Natives/Alaskans and household income with householder over the age of 65 in the United States with a correlation coefficient (R) of -0.204 and weighted average of $52,081. Similarly, the statistical analysis conducted on geographies consisting of 308,657,896 people shows a moderate negative correlation between the proportion of Blackfeet and household income with householder over the age of 65 in the United States with a correlation coefficient (R) of -0.485 and weighted average of $54,029, a difference of 3.7%.
Householder Income Over 65 years Correlation Summary
| Measurement | Native/Alaskan | Blackfeet |
| Minimum | $19,554 | $14,196 |
| Maximum | $78,193 | $74,087 |
| Range | $58,639 | $59,891 |
| Mean | $45,041 | $43,504 |
| Median | $44,466 | $44,167 |
| Interquartile 25% (IQ1) | $39,545 | $32,958 |
| Interquartile 75% (IQ3) | $51,398 | $53,466 |
| Interquartile Range (IQR) | $11,852 | $20,508 |
| Standard Deviation (Sample) | $9,551 | $14,024 |
| Standard Deviation (Population) | $9,526 | $13,852 |
Similar Demographics by Householder Income Over 65 years
Demographics Similar to Natives/Alaskans by Householder Income Over 65 years
In terms of householder income over 65 years, the demographic groups most similar to Natives/Alaskans are Immigrants from Nicaragua ($52,085, a difference of 0.010%), U.S. Virgin Islander ($52,072, a difference of 0.020%), Immigrants from the Azores ($52,121, a difference of 0.080%), Creek ($51,949, a difference of 0.25%), and Immigrants from St. Vincent and the Grenadines ($51,922, a difference of 0.30%).
| Demographics | Rating | Rank | Householder Income Over 65 years |
| Hispanics or Latinos | 0.0 /100 | #307 | Tragic $52,832 |
| Immigrants | Mexico | 0.0 /100 | #308 | Tragic $52,801 |
| Hondurans | 0.0 /100 | #309 | Tragic $52,634 |
| Sioux | 0.0 /100 | #310 | Tragic $52,509 |
| Seminole | 0.0 /100 | #311 | Tragic $52,373 |
| Immigrants | Azores | 0.0 /100 | #312 | Tragic $52,121 |
| Immigrants | Nicaragua | 0.0 /100 | #313 | Tragic $52,085 |
| Natives/Alaskans | 0.0 /100 | #314 | Tragic $52,081 |
| U.S. Virgin Islanders | 0.0 /100 | #315 | Tragic $52,072 |
| Creek | 0.0 /100 | #316 | Tragic $51,949 |
| Immigrants | St. Vincent and the Grenadines | 0.0 /100 | #317 | Tragic $51,922 |
| Haitians | 0.0 /100 | #318 | Tragic $51,912 |
| Immigrants | Honduras | 0.0 /100 | #319 | Tragic $51,888 |
| Colville | 0.0 /100 | #320 | Tragic $51,739 |
| Menominee | 0.0 /100 | #321 | Tragic $51,719 |
Demographics Similar to Blackfeet by Householder Income Over 65 years
In terms of householder income over 65 years, the demographic groups most similar to Blackfeet are Immigrants from Ecuador ($54,030, a difference of 0.0%), Immigrants from Jamaica ($54,027, a difference of 0.0%), Somali ($54,004, a difference of 0.050%), Immigrants from Armenia ($53,974, a difference of 0.10%), and Cheyenne ($54,096, a difference of 0.12%).
| Demographics | Rating | Rank | Householder Income Over 65 years |
| Potawatomi | 0.1 /100 | #272 | Tragic $54,212 |
| Indonesians | 0.1 /100 | #273 | Tragic $54,176 |
| Barbadians | 0.1 /100 | #274 | Tragic $54,163 |
| Cherokee | 0.1 /100 | #275 | Tragic $54,133 |
| Cree | 0.1 /100 | #276 | Tragic $54,129 |
| Cheyenne | 0.1 /100 | #277 | Tragic $54,096 |
| Immigrants | Ecuador | 0.1 /100 | #278 | Tragic $54,030 |
| Blackfeet | 0.1 /100 | #279 | Tragic $54,029 |
| Immigrants | Jamaica | 0.1 /100 | #280 | Tragic $54,027 |
| Somalis | 0.1 /100 | #281 | Tragic $54,004 |
| Immigrants | Armenia | 0.1 /100 | #282 | Tragic $53,974 |
| Immigrants | Liberia | 0.1 /100 | #283 | Tragic $53,967 |
| Immigrants | Guatemala | 0.1 /100 | #284 | Tragic $53,950 |
| Mexicans | 0.1 /100 | #285 | Tragic $53,897 |
| Chippewa | 0.1 /100 | #286 | Tragic $53,847 |