Fijian vs Puget Sound Salish Single Female Poverty
COMPARE
Fijian
Puget Sound Salish
Single Female Poverty
Single Female Poverty Comparison
Fijians
Puget Sound Salish
23.1%
SINGLE FEMALE POVERTY
0.2/ 100
METRIC RATING
268th/ 347
METRIC RANK
20.6%
SINGLE FEMALE POVERTY
79.6/ 100
METRIC RATING
151st/ 347
METRIC RANK
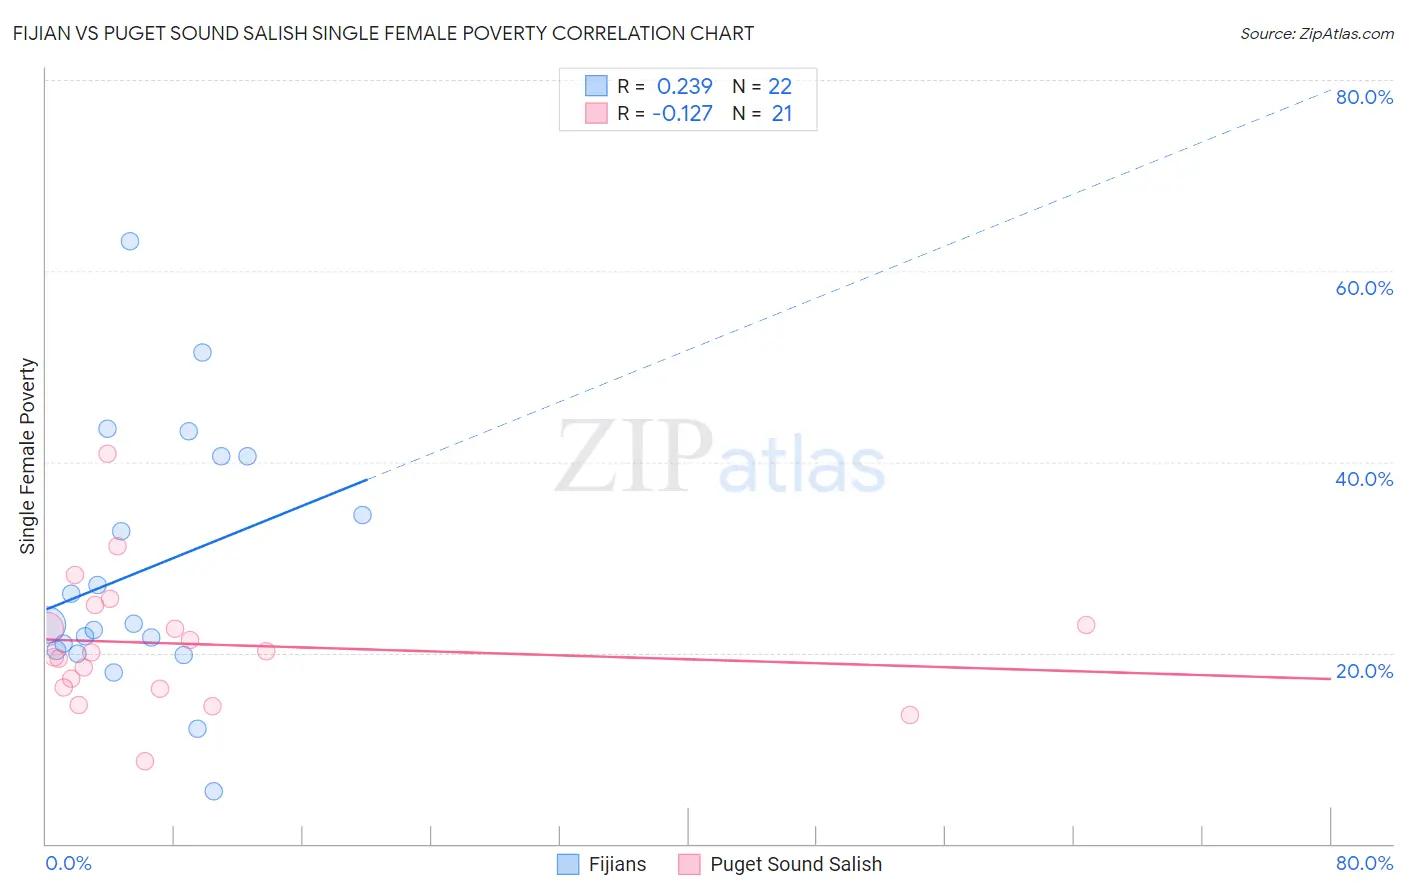
Fijian vs Puget Sound Salish Single Female Poverty Correlation Chart
The statistical analysis conducted on geographies consisting of 55,892,814 people shows a weak positive correlation between the proportion of Fijians and poverty level among single females in the United States with a correlation coefficient (R) of 0.239 and weighted average of 23.1%. Similarly, the statistical analysis conducted on geographies consisting of 45,841,624 people shows a poor negative correlation between the proportion of Puget Sound Salish and poverty level among single females in the United States with a correlation coefficient (R) of -0.127 and weighted average of 20.6%, a difference of 12.2%.
Single Female Poverty Correlation Summary
| Measurement | Fijian | Puget Sound Salish |
| Minimum | 5.6% | 8.6% |
| Maximum | 63.2% | 40.8% |
| Range | 57.6% | 32.2% |
| Mean | 28.7% | 20.9% |
| Median | 23.0% | 20.0% |
| Interquartile 25% (IQ1) | 20.3% | 16.4% |
| Interquartile 75% (IQ3) | 40.6% | 24.0% |
| Interquartile Range (IQR) | 20.3% | 7.6% |
| Standard Deviation (Sample) | 13.6% | 6.9% |
| Standard Deviation (Population) | 13.3% | 6.8% |
Similar Demographics by Single Female Poverty
Demographics Similar to Fijians by Single Female Poverty
In terms of single female poverty, the demographic groups most similar to Fijians are Hmong (23.1%, a difference of 0.030%), Senegalese (23.0%, a difference of 0.070%), Immigrants from Micronesia (23.0%, a difference of 0.13%), Inupiat (23.1%, a difference of 0.28%), and Central American (23.0%, a difference of 0.34%).
| Demographics | Rating | Rank | Single Female Poverty |
| Immigrants | Cabo Verde | 0.4 /100 | #261 | Tragic 22.8% |
| British West Indians | 0.4 /100 | #262 | Tragic 22.8% |
| Scotch-Irish | 0.3 /100 | #263 | Tragic 22.9% |
| Immigrants | Laos | 0.3 /100 | #264 | Tragic 22.9% |
| Central Americans | 0.2 /100 | #265 | Tragic 23.0% |
| Immigrants | Micronesia | 0.2 /100 | #266 | Tragic 23.0% |
| Senegalese | 0.2 /100 | #267 | Tragic 23.0% |
| Fijians | 0.2 /100 | #268 | Tragic 23.1% |
| Hmong | 0.2 /100 | #269 | Tragic 23.1% |
| Inupiat | 0.2 /100 | #270 | Tragic 23.1% |
| Sub-Saharan Africans | 0.1 /100 | #271 | Tragic 23.2% |
| Immigrants | Senegal | 0.1 /100 | #272 | Tragic 23.2% |
| Alaska Natives | 0.1 /100 | #273 | Tragic 23.3% |
| Marshallese | 0.1 /100 | #274 | Tragic 23.3% |
| Mexican American Indians | 0.1 /100 | #275 | Tragic 23.4% |
Demographics Similar to Puget Sound Salish by Single Female Poverty
In terms of single female poverty, the demographic groups most similar to Puget Sound Salish are Immigrants from Denmark (20.5%, a difference of 0.090%), Portuguese (20.5%, a difference of 0.19%), Immigrants from Uruguay (20.6%, a difference of 0.19%), Swedish (20.6%, a difference of 0.24%), and Immigrants from Western Europe (20.6%, a difference of 0.27%).
| Demographics | Rating | Rank | Single Female Poverty |
| Immigrants | Uzbekistan | 88.3 /100 | #144 | Excellent 20.3% |
| Austrians | 85.8 /100 | #145 | Excellent 20.4% |
| Venezuelans | 85.5 /100 | #146 | Excellent 20.4% |
| South Africans | 85.3 /100 | #147 | Excellent 20.4% |
| Luxembourgers | 84.9 /100 | #148 | Excellent 20.4% |
| Portuguese | 81.5 /100 | #149 | Excellent 20.5% |
| Immigrants | Denmark | 80.5 /100 | #150 | Excellent 20.5% |
| Puget Sound Salish | 79.6 /100 | #151 | Good 20.6% |
| Immigrants | Uruguay | 77.7 /100 | #152 | Good 20.6% |
| Swedes | 77.1 /100 | #153 | Good 20.6% |
| Immigrants | Western Europe | 76.7 /100 | #154 | Good 20.6% |
| Samoans | 76.0 /100 | #155 | Good 20.6% |
| South American Indians | 75.7 /100 | #156 | Good 20.6% |
| Immigrants | Oceania | 74.3 /100 | #157 | Good 20.7% |
| Danes | 73.0 /100 | #158 | Good 20.7% |