Immigrants from Japan vs Ecuadorian Wage/Income Gap

COMPARE

Immigrants from Japan
Race
Ancestry
AfghanAfricanAlaska NativeAlaskan AthabascanAlbanianAleutAlsatianAmericanApacheArabArapahoArgentineanArmenianAssyrian/Chaldean/SyriacAustralianAustrianBahamianBangladeshiBarbadianBasqueBelgianBelizeanBermudanBhutaneseBlackfeetBolivianBrazilianBritishBritish West IndianBulgarianBurmeseCajunCambodianCanadianCape VerdeanCarpatho RusynCelticCentral AmericanCentral American IndianCherokeeCheyenneChickasawChileanChineseChippewaChoctawColombianColvilleComancheCosta RicanCreeCreekCroatianCrowCubanCypriotCzechCzechoslovakianDanishDelawareDominicanDutchDutch West IndianEastern EuropeanEgyptianEnglishEstonianEthiopianEuropeanFijianFilipinoFinnishFrenchFrench American IndianFrench CanadianGermanGerman RussianGhanaianGreekGuamanian/ChamorroGuatemalanGuyaneseHaitianHmongHonduranHopiHoumaHungarianIcelanderIndian (Asian)IndonesianInupiatIranianIraqiIrishIroquoisIsraeliItalianJamaicanJapaneseJordanianKenyanKiowaKoreanLaotianLatvianLebaneseLiberianLithuanianLumbeeLuxembourgerMacedonianMalaysianMalteseMarshalleseMenomineeMexicanMexican American IndianMongolianMoroccanNative HawaiianNavajoNepaleseNew ZealanderNicaraguanNigerianNorthern EuropeanNorwegianOkinawanOsageOttawaPaiutePakistaniPalestinianPanamanianParaguayanPennsylvania GermanPeruvianPimaPolishPortuguesePotawatomiPuebloPuerto RicanPuget Sound SalishRomanianRussianSalvadoranSamoanScandinavianScotch-IrishScottishSeminoleSenegaleseSerbianShoshoneSierra LeoneanSiouxSlavicSlovakSloveneSomaliSouth AfricanSouth AmericanSouth American IndianSoviet UnionSpaniardSpanishSpanish AmericanSpanish American IndianSri LankanSubsaharan AfricanSudaneseSwedishSwissSyrianTaiwaneseThaiTlingit-HaidaTohono O'OdhamTonganTrinidadian and TobagonianTsimshianTurkishU.S. Virgin IslanderUgandanUkrainianUruguayanUteVenezuelanVietnameseWelshWest IndianYakamaYaquiYugoslavianYumanYup'ikZimbabwean
Immigration
NonimmigrantsImmigrantsAfghanistanAfricaAlbaniaArgentinaArmeniaAsiaAustraliaAustriaBahamasBangladeshBarbadosBelarusBelgiumBelizeBoliviaBosnia and HerzegovinaBrazilBulgariaBurma/MyanmarCabo VerdeCambodiaCameroonCanadaCaribbeanCentral AmericaChileChinaColombiaCongoCosta RicaCroatiaCubaCzechoslovakiaDenmarkDominicaDominican RepublicEastern AfricaEastern AsiaEastern EuropeEcuadorEgyptEl SalvadorEnglandEritreaEthiopiaEuropeFijiFranceGermanyGhanaGreeceGrenadaGuatemalaGuyanaHaitiHondurasHong KongHungaryIndiaIndonesiaIranIraqIrelandIsraelItalyJamaicaJapanJordanKazakhstanKenyaKoreaKuwaitLaosLatin AmericaLatviaLebanonLiberiaLithuaniaMalaysiaMexicoMicronesiaMiddle AfricaMoldovaMoroccoNepalNetherlandsNicaraguaNigeriaNorth AmericaNorth MacedoniaNorthern AfricaNorthern EuropeNorwayOceaniaPakistanPanamaPeruPhilippinesPolandPortugalRomaniaRussiaSaudi ArabiaScotlandSenegalSerbiaSierra LeoneSingaporeSomaliaSouth AfricaSouth AmericaSouth Central AsiaSouth Eastern AsiaSouthern EuropeSpainSri LankaSt. Vincent and the GrenadinesSudanSwedenSwitzerlandSyriaTaiwanThailandTrinidad and TobagoTurkeyUgandaUkraineUruguayUzbekistanVenezuelaVietnamWest IndiesWestern AfricaWestern AsiaWestern EuropeYemenZaireZimbabweAzores
Ecuadorian
Race
Ancestry
AfghanAfricanAlaska NativeAlaskan AthabascanAlbanianAleutAlsatianAmericanApacheArabArapahoArgentineanArmenianAssyrian/Chaldean/SyriacAustralianAustrianBahamianBangladeshiBarbadianBasqueBelgianBelizeanBermudanBhutaneseBlackfeetBolivianBrazilianBritishBritish West IndianBulgarianBurmeseCajunCambodianCanadianCape VerdeanCarpatho RusynCelticCentral AmericanCentral American IndianCherokeeCheyenneChickasawChileanChineseChippewaChoctawColombianColvilleComancheCosta RicanCreeCreekCroatianCrowCubanCypriotCzechCzechoslovakianDanishDelawareDominicanDutchDutch West IndianEastern EuropeanEcuadorianEgyptianEnglishEstonianEthiopianEuropeanFijianFilipinoFinnishFrenchFrench American IndianFrench CanadianGermanGerman RussianGhanaianGreekGuamanian/ChamorroGuatemalanGuyaneseHaitianHmongHonduranHopiHoumaHungarianIcelanderIndian (Asian)IndonesianInupiatIranianIraqiIrishIroquoisIsraeliItalianJamaicanJapaneseJordanianKenyanKiowaKoreanLaotianLatvianLebaneseLiberianLithuanianLumbeeLuxembourgerMacedonianMalaysianMalteseMarshalleseMenomineeMexicanMexican American IndianMongolianMoroccanNative HawaiianNavajoNepaleseNew ZealanderNicaraguanNigerianNorthern EuropeanNorwegianOkinawanOsageOttawaPaiutePakistaniPalestinianPanamanianParaguayanPennsylvania GermanPeruvianPimaPolishPortuguesePotawatomiPuebloPuerto RicanPuget Sound SalishRomanianRussianSalvadoranSamoanScandinavianScotch-IrishScottishSeminoleSenegaleseSerbianShoshoneSierra LeoneanSiouxSlavicSlovakSloveneSomaliSouth AfricanSouth AmericanSouth American IndianSoviet UnionSpaniardSpanishSpanish AmericanSpanish American IndianSri LankanSubsaharan AfricanSudaneseSwedishSwissSyrianTaiwaneseThaiTlingit-HaidaTohono O'OdhamTonganTrinidadian and TobagonianTsimshianTurkishU.S. Virgin IslanderUgandanUkrainianUruguayanUteVenezuelanVietnameseWelshWest IndianYakamaYaquiYugoslavianYumanYup'ikZimbabwean
Immigration
NonimmigrantsImmigrantsAfghanistanAfricaAlbaniaArgentinaArmeniaAsiaAustraliaAustriaBahamasBangladeshBarbadosBelarusBelgiumBelizeBoliviaBosnia and HerzegovinaBrazilBulgariaBurma/MyanmarCabo VerdeCambodiaCameroonCanadaCaribbeanCentral AmericaChileChinaColombiaCongoCosta RicaCroatiaCubaCzechoslovakiaDenmarkDominicaDominican RepublicEastern AfricaEastern AsiaEastern EuropeEcuadorEgyptEl SalvadorEnglandEritreaEthiopiaEuropeFijiFranceGermanyGhanaGreeceGrenadaGuatemalaGuyanaHaitiHondurasHong KongHungaryIndiaIndonesiaIranIraqIrelandIsraelItalyJamaicaJordanKazakhstanKenyaKoreaKuwaitLaosLatin AmericaLatviaLebanonLiberiaLithuaniaMalaysiaMexicoMicronesiaMiddle AfricaMoldovaMoroccoNepalNetherlandsNicaraguaNigeriaNorth AmericaNorth MacedoniaNorthern AfricaNorthern EuropeNorwayOceaniaPakistanPanamaPeruPhilippinesPolandPortugalRomaniaRussiaSaudi ArabiaScotlandSenegalSerbiaSierra LeoneSingaporeSomaliaSouth AfricaSouth AmericaSouth Central AsiaSouth Eastern AsiaSouthern EuropeSpainSri LankaSt. Vincent and the GrenadinesSudanSwedenSwitzerlandSyriaTaiwanThailandTrinidad and TobagoTurkeyUgandaUkraineUruguayUzbekistanVenezuelaVietnamWest IndiesWestern AfricaWestern AsiaWestern EuropeYemenZaireZimbabweAzores
Wage/Income Gap
Income
Poverty
Unemployment
Labor Participation
Family Structure
Vehicle Availability
Education Level
Disability

Wage/Income Gap Comparison

Immigrants from Japan

Ecuadorians

Tragic
Exceptional
27.9%
WAGE/INCOME GAP
0.7/ 100
METRIC RATING
275th/ 347
METRIC RANK
22.9%
WAGE/INCOME GAP
99.9/ 100
METRIC RATING
76th/ 347
METRIC RANK

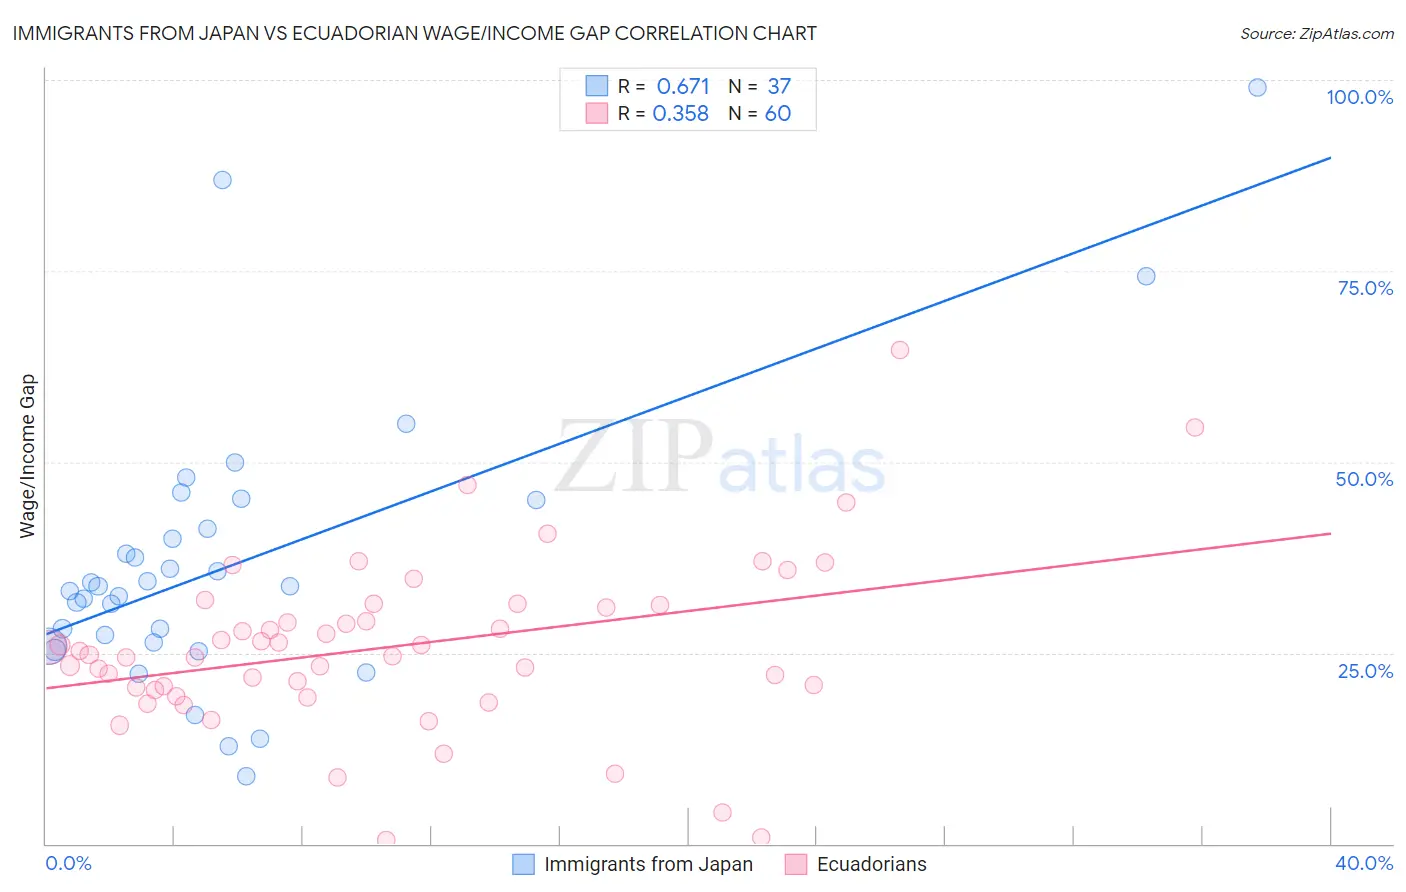
Immigrants from Japan vs Ecuadorian Wage/Income Gap Correlation Chart

The statistical analysis conducted on geographies consisting of 339,998,398 people shows a significant positive correlation between the proportion of Immigrants from Japan and wage/income gap percentage in the United States with a correlation coefficient (R) of 0.671 and weighted average of 27.9%. Similarly, the statistical analysis conducted on geographies consisting of 317,709,562 people shows a mild positive correlation between the proportion of Ecuadorians and wage/income gap percentage in the United States with a correlation coefficient (R) of 0.358 and weighted average of 22.9%, a difference of 21.6%.
Immigrants from Japan vs Ecuadorian Wage/Income Gap

Wage/Income Gap Correlation Summary

MeasurementImmigrants from JapanEcuadorian
Minimum8.9%0.44%
Maximum99.0%64.7%
Range90.1%64.2%
Mean36.7%25.7%
Median33.6%25.0%
Interquartile 25% (IQ1)26.1%20.3%
Interquartile 75% (IQ3)43.1%31.1%
Interquartile Range (IQR)17.0%10.8%
Standard Deviation (Sample)18.4%11.3%
Standard Deviation (Population)18.2%11.2%

Similar Demographics by Wage/Income Gap

Demographics Similar to Immigrants from Japan by Wage/Income Gap

In terms of wage/income gap, the demographic groups most similar to Immigrants from Japan are Lebanese (27.9%, a difference of 0.030%), Latvian (27.9%, a difference of 0.030%), American (27.8%, a difference of 0.080%), Immigrants from England (27.9%, a difference of 0.11%), and Bulgarian (27.8%, a difference of 0.12%).
DemographicsRating | RankWage/Income Gap
New Zealanders
1.0
/100
|
#268
Tragic
27.7%
Potawatomi
0.9
/100
|
#269
Tragic
27.7%
Immigrants | Western Europe
0.9
/100
|
#270
Tragic
27.8%
Ute
0.8
/100
|
#271
Tragic
27.8%
Immigrants | Korea
0.8
/100
|
#272
Tragic
27.8%
Bulgarians
0.7
/100
|
#273
Tragic
27.8%
Americans
0.7
/100
|
#274
Tragic
27.8%
Immigrants | Japan
0.7
/100
|
#275
Tragic
27.9%
Lebanese
0.7
/100
|
#276
Tragic
27.9%
Latvians
0.7
/100
|
#277
Tragic
27.9%
Immigrants | England
0.6
/100
|
#278
Tragic
27.9%
Romanians
0.5
/100
|
#279
Tragic
28.0%
Russians
0.5
/100
|
#280
Tragic
28.0%
Burmese
0.5
/100
|
#281
Tragic
28.0%
South Africans
0.5
/100
|
#282
Tragic
28.0%

Demographics Similar to Ecuadorians by Wage/Income Gap

In terms of wage/income gap, the demographic groups most similar to Ecuadorians are Fijian (22.9%, a difference of 0.010%), African (22.9%, a difference of 0.13%), Nigerian (23.0%, a difference of 0.24%), Immigrants from Burma/Myanmar (22.8%, a difference of 0.30%), and Immigrants from Nicaragua (23.0%, a difference of 0.33%).
DemographicsRating | RankWage/Income Gap
Indonesians
99.9
/100
|
#69
Exceptional
22.7%
Immigrants | Uzbekistan
99.9
/100
|
#70
Exceptional
22.7%
Immigrants | El Salvador
99.9
/100
|
#71
Exceptional
22.8%
Sub-Saharan Africans
99.9
/100
|
#72
Exceptional
22.8%
Immigrants | Eastern Africa
99.9
/100
|
#73
Exceptional
22.8%
Immigrants | Burma/Myanmar
99.9
/100
|
#74
Exceptional
22.8%
Fijians
99.9
/100
|
#75
Exceptional
22.9%
Ecuadorians
99.9
/100
|
#76
Exceptional
22.9%
Africans
99.9
/100
|
#77
Exceptional
22.9%
Nigerians
99.9
/100
|
#78
Exceptional
23.0%
Immigrants | Nicaragua
99.9
/100
|
#79
Exceptional
23.0%
Salvadorans
99.9
/100
|
#80
Exceptional
23.0%
Bermudans
99.8
/100
|
#81
Exceptional
23.1%
Central Americans
99.8
/100
|
#82
Exceptional
23.1%
Immigrants | Africa
99.8
/100
|
#83
Exceptional
23.2%