Swiss vs Ecuadorian Wage/Income Gap
COMPARE
Swiss
Ecuadorian
Wage/Income Gap
Wage/Income Gap Comparison
Swiss
Ecuadorians
30.0%
WAGE/INCOME GAP
0.0/ 100
METRIC RATING
340th/ 347
METRIC RANK
22.9%
WAGE/INCOME GAP
99.9/ 100
METRIC RATING
76th/ 347
METRIC RANK
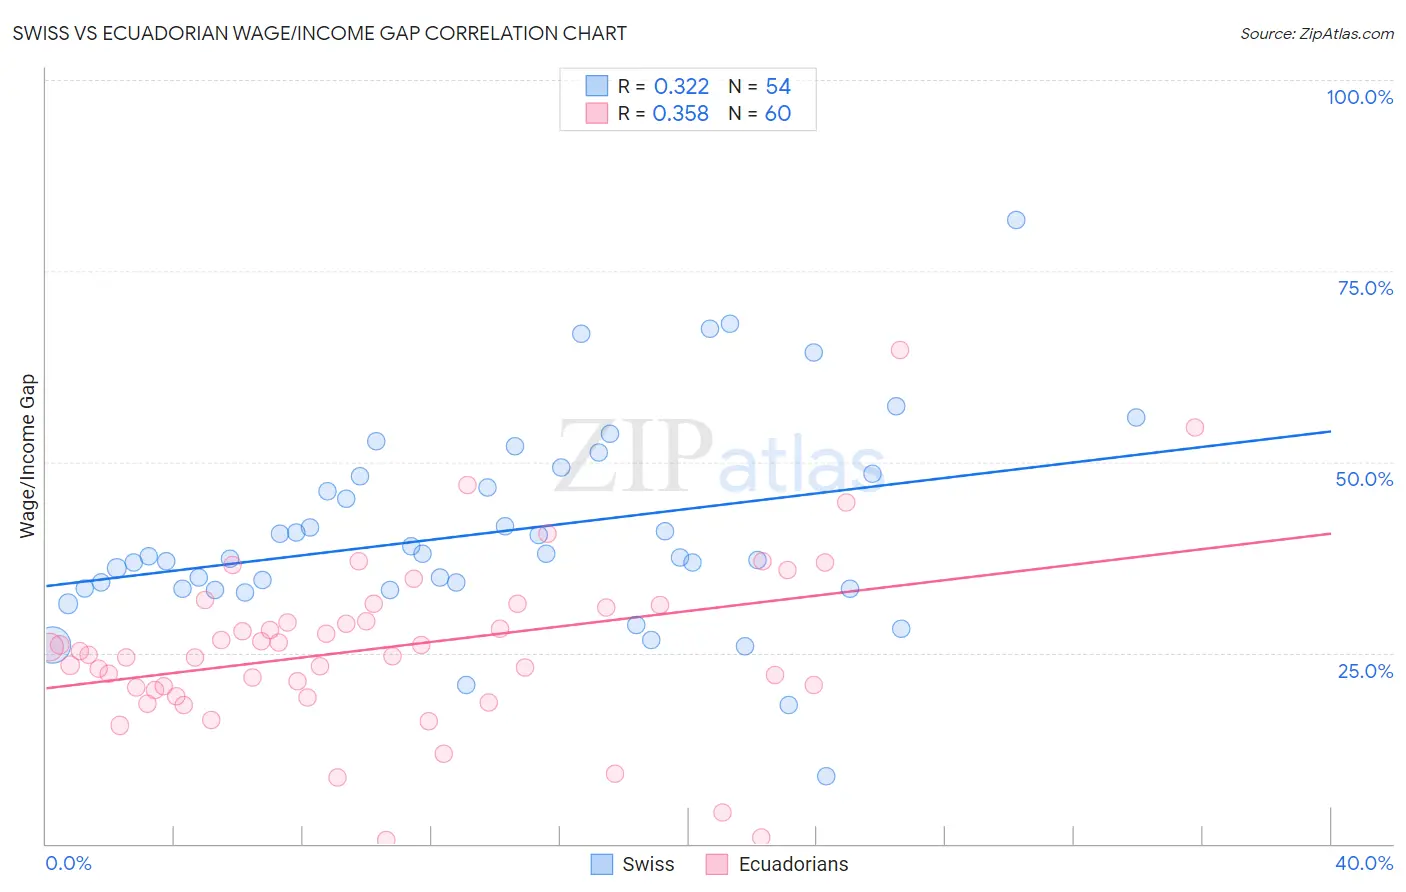
Swiss vs Ecuadorian Wage/Income Gap Correlation Chart
The statistical analysis conducted on geographies consisting of 464,189,171 people shows a mild positive correlation between the proportion of Swiss and wage/income gap percentage in the United States with a correlation coefficient (R) of 0.322 and weighted average of 30.0%. Similarly, the statistical analysis conducted on geographies consisting of 317,709,562 people shows a mild positive correlation between the proportion of Ecuadorians and wage/income gap percentage in the United States with a correlation coefficient (R) of 0.358 and weighted average of 22.9%, a difference of 30.8%.
Wage/Income Gap Correlation Summary
| Measurement | Swiss | Ecuadorian |
| Minimum | 8.8% | 0.44% |
| Maximum | 81.7% | 64.7% |
| Range | 72.9% | 64.2% |
| Mean | 40.7% | 25.7% |
| Median | 37.6% | 25.0% |
| Interquartile 25% (IQ1) | 33.4% | 20.3% |
| Interquartile 75% (IQ3) | 48.0% | 31.1% |
| Interquartile Range (IQR) | 14.6% | 10.8% |
| Standard Deviation (Sample) | 13.2% | 11.3% |
| Standard Deviation (Population) | 13.1% | 11.2% |
Similar Demographics by Wage/Income Gap
Demographics Similar to Swiss by Wage/Income Gap
In terms of wage/income gap, the demographic groups most similar to Swiss are Iranian (29.7%, a difference of 0.83%), Filipino (29.7%, a difference of 0.89%), Dutch (29.6%, a difference of 1.1%), Thai (30.5%, a difference of 1.7%), and English (29.5%, a difference of 1.7%).
| Demographics | Rating | Rank | Wage/Income Gap |
| Europeans | 0.0 /100 | #333 | Tragic 29.4% |
| Swedes | 0.0 /100 | #334 | Tragic 29.4% |
| Immigrants | Taiwan | 0.0 /100 | #335 | Tragic 29.5% |
| English | 0.0 /100 | #336 | Tragic 29.5% |
| Dutch | 0.0 /100 | #337 | Tragic 29.6% |
| Filipinos | 0.0 /100 | #338 | Tragic 29.7% |
| Iranians | 0.0 /100 | #339 | Tragic 29.7% |
| Swiss | 0.0 /100 | #340 | Tragic 30.0% |
| Thais | 0.0 /100 | #341 | Tragic 30.5% |
| Pennsylvania Germans | 0.0 /100 | #342 | Tragic 30.7% |
| Danes | 0.0 /100 | #343 | Tragic 31.0% |
| Assyrians/Chaldeans/Syriacs | 0.0 /100 | #344 | Tragic 31.0% |
| Immigrants | India | 0.0 /100 | #345 | Tragic 31.5% |
| Cajuns | 0.0 /100 | #346 | Tragic 33.9% |
| Houma | 0.0 /100 | #347 | Tragic 38.7% |
Demographics Similar to Ecuadorians by Wage/Income Gap
In terms of wage/income gap, the demographic groups most similar to Ecuadorians are Fijian (22.9%, a difference of 0.010%), African (22.9%, a difference of 0.13%), Nigerian (23.0%, a difference of 0.24%), Immigrants from Burma/Myanmar (22.8%, a difference of 0.30%), and Immigrants from Nicaragua (23.0%, a difference of 0.33%).
| Demographics | Rating | Rank | Wage/Income Gap |
| Indonesians | 99.9 /100 | #69 | Exceptional 22.7% |
| Immigrants | Uzbekistan | 99.9 /100 | #70 | Exceptional 22.7% |
| Immigrants | El Salvador | 99.9 /100 | #71 | Exceptional 22.8% |
| Sub-Saharan Africans | 99.9 /100 | #72 | Exceptional 22.8% |
| Immigrants | Eastern Africa | 99.9 /100 | #73 | Exceptional 22.8% |
| Immigrants | Burma/Myanmar | 99.9 /100 | #74 | Exceptional 22.8% |
| Fijians | 99.9 /100 | #75 | Exceptional 22.9% |
| Ecuadorians | 99.9 /100 | #76 | Exceptional 22.9% |
| Africans | 99.9 /100 | #77 | Exceptional 22.9% |
| Nigerians | 99.9 /100 | #78 | Exceptional 23.0% |
| Immigrants | Nicaragua | 99.9 /100 | #79 | Exceptional 23.0% |
| Salvadorans | 99.9 /100 | #80 | Exceptional 23.0% |
| Bermudans | 99.8 /100 | #81 | Exceptional 23.1% |
| Central Americans | 99.8 /100 | #82 | Exceptional 23.1% |
| Immigrants | Africa | 99.8 /100 | #83 | Exceptional 23.2% |