Aleut vs Ecuadorian 5th Grade
COMPARE
Aleut
Ecuadorian
5th Grade
5th Grade Comparison
Aleuts
Ecuadorians
98.0%
5TH GRADE
99.9/ 100
METRIC RATING
44th/ 347
METRIC RANK
96.0%
5TH GRADE
0.0/ 100
METRIC RATING
308th/ 347
METRIC RANK
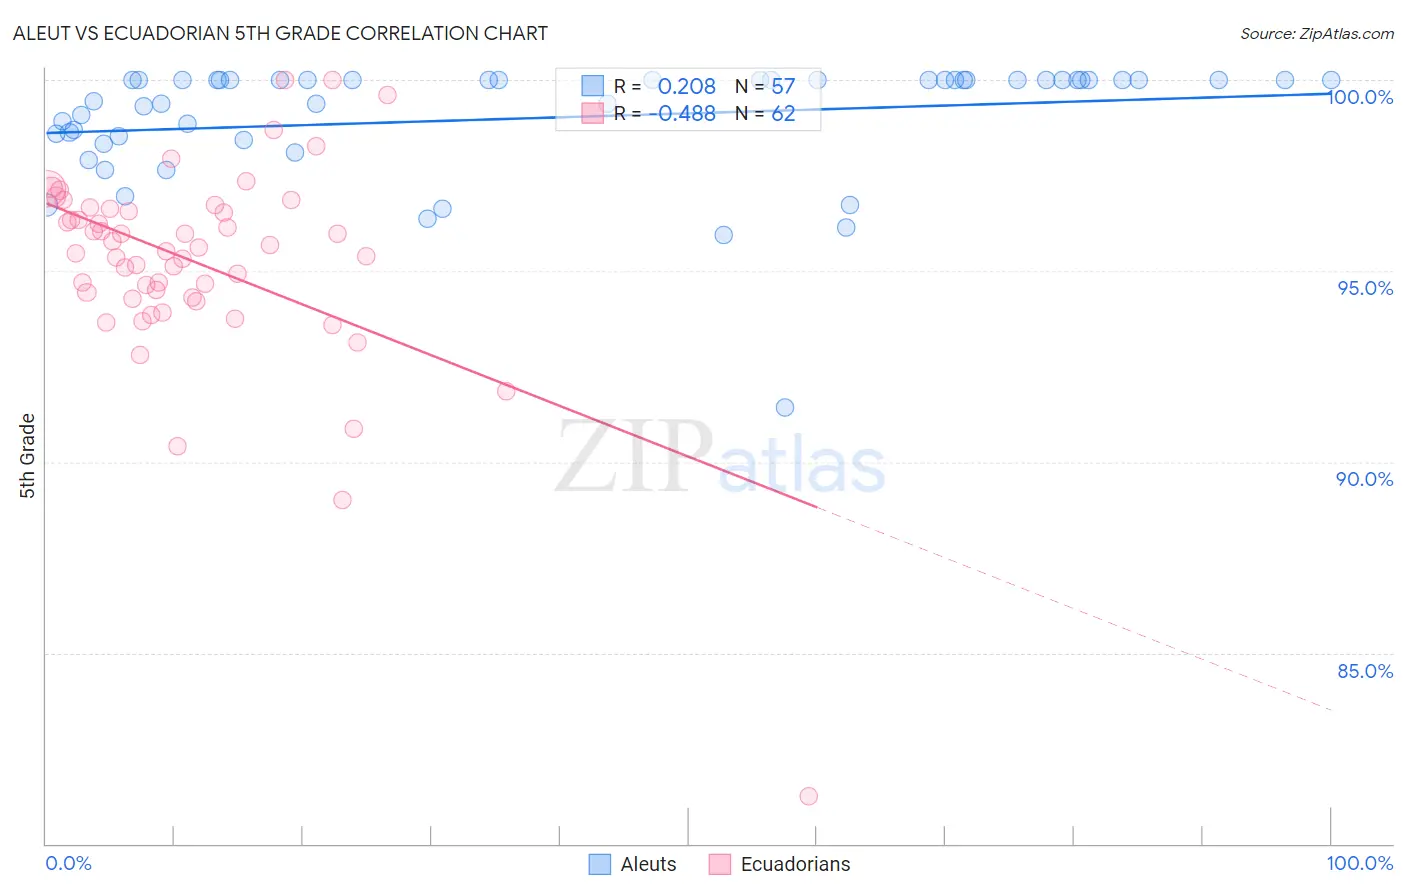
Aleut vs Ecuadorian 5th Grade Correlation Chart
The statistical analysis conducted on geographies consisting of 61,781,058 people shows a weak positive correlation between the proportion of Aleuts and percentage of population with at least 5th grade education in the United States with a correlation coefficient (R) of 0.208 and weighted average of 98.0%. Similarly, the statistical analysis conducted on geographies consisting of 317,865,755 people shows a moderate negative correlation between the proportion of Ecuadorians and percentage of population with at least 5th grade education in the United States with a correlation coefficient (R) of -0.488 and weighted average of 96.0%, a difference of 2.1%.
5th Grade Correlation Summary
| Measurement | Aleut | Ecuadorian |
| Minimum | 91.4% | 81.2% |
| Maximum | 100.0% | 100.0% |
| Range | 8.6% | 18.7% |
| Mean | 99.0% | 95.2% |
| Median | 100.0% | 95.6% |
| Interquartile 25% (IQ1) | 98.5% | 94.3% |
| Interquartile 75% (IQ3) | 100.0% | 96.6% |
| Interquartile Range (IQR) | 1.5% | 2.3% |
| Standard Deviation (Sample) | 1.6% | 2.7% |
| Standard Deviation (Population) | 1.6% | 2.7% |
Similar Demographics by 5th Grade
Demographics Similar to Aleuts by 5th Grade
In terms of 5th grade, the demographic groups most similar to Aleuts are Ottawa (98.0%, a difference of 0.010%), Czechoslovakian (98.0%, a difference of 0.010%), Arapaho (98.0%, a difference of 0.010%), Northern European (98.0%, a difference of 0.020%), and Native Hawaiian (98.0%, a difference of 0.020%).
| Demographics | Rating | Rank | 5th Grade |
| Latvians | 99.9 /100 | #37 | Exceptional 98.1% |
| Belgians | 99.9 /100 | #38 | Exceptional 98.1% |
| Luxembourgers | 99.9 /100 | #39 | Exceptional 98.1% |
| Eastern Europeans | 99.9 /100 | #40 | Exceptional 98.1% |
| Hungarians | 99.9 /100 | #41 | Exceptional 98.0% |
| Northern Europeans | 99.9 /100 | #42 | Exceptional 98.0% |
| Ottawa | 99.9 /100 | #43 | Exceptional 98.0% |
| Aleuts | 99.9 /100 | #44 | Exceptional 98.0% |
| Czechoslovakians | 99.9 /100 | #45 | Exceptional 98.0% |
| Arapaho | 99.9 /100 | #46 | Exceptional 98.0% |
| Native Hawaiians | 99.9 /100 | #47 | Exceptional 98.0% |
| Bulgarians | 99.8 /100 | #48 | Exceptional 98.0% |
| Estonians | 99.8 /100 | #49 | Exceptional 98.0% |
| Immigrants | Scotland | 99.8 /100 | #50 | Exceptional 98.0% |
| Celtics | 99.8 /100 | #51 | Exceptional 98.0% |
Demographics Similar to Ecuadorians by 5th Grade
In terms of 5th grade, the demographic groups most similar to Ecuadorians are Immigrants from Haiti (96.0%, a difference of 0.010%), Immigrants from Caribbean (96.0%, a difference of 0.010%), Immigrants from Guyana (96.0%, a difference of 0.010%), Immigrants from Laos (96.0%, a difference of 0.030%), and Immigrants from Burma/Myanmar (96.1%, a difference of 0.040%).
| Demographics | Rating | Rank | 5th Grade |
| Immigrants | Cuba | 0.0 /100 | #301 | Tragic 96.1% |
| Guyanese | 0.0 /100 | #302 | Tragic 96.1% |
| Puerto Ricans | 0.0 /100 | #303 | Tragic 96.1% |
| Immigrants | Burma/Myanmar | 0.0 /100 | #304 | Tragic 96.1% |
| Immigrants | Laos | 0.0 /100 | #305 | Tragic 96.0% |
| Immigrants | Haiti | 0.0 /100 | #306 | Tragic 96.0% |
| Immigrants | Caribbean | 0.0 /100 | #307 | Tragic 96.0% |
| Ecuadorians | 0.0 /100 | #308 | Tragic 96.0% |
| Immigrants | Guyana | 0.0 /100 | #309 | Tragic 96.0% |
| Indonesians | 0.0 /100 | #310 | Tragic 96.0% |
| Immigrants | Bangladesh | 0.0 /100 | #311 | Tragic 96.0% |
| Vietnamese | 0.0 /100 | #312 | Tragic 95.9% |
| Bangladeshis | 0.0 /100 | #313 | Tragic 95.9% |
| Immigrants | Portugal | 0.0 /100 | #314 | Tragic 95.9% |
| Nicaraguans | 0.0 /100 | #315 | Tragic 95.9% |