Assyrian/Chaldean/Syriac vs Immigrants from Zimbabwe Single Father Households
COMPARE
Assyrian/Chaldean/Syriac
Immigrants from Zimbabwe
Single Father Households
Single Father Households Comparison
Assyrians/Chaldeans/Syriacs
Immigrants from Zimbabwe
2.0%
SINGLE FATHER HOUSEHOLDS
100.0/ 100
METRIC RATING
26th/ 347
METRIC RANK
2.2%
SINGLE FATHER HOUSEHOLDS
90.2/ 100
METRIC RATING
145th/ 347
METRIC RANK
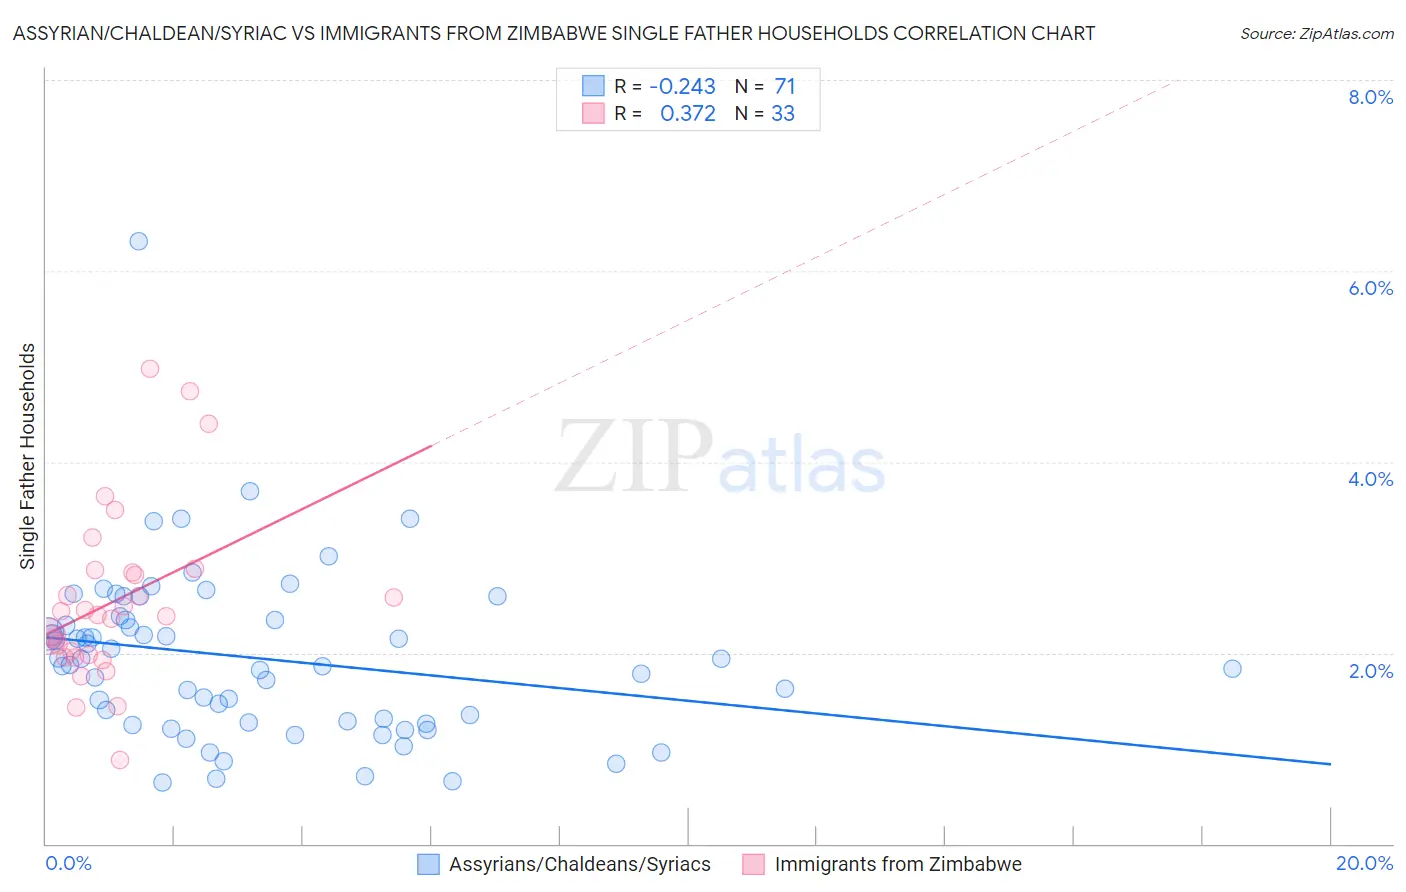
Assyrian/Chaldean/Syriac vs Immigrants from Zimbabwe Single Father Households Correlation Chart
The statistical analysis conducted on geographies consisting of 110,024,022 people shows a weak negative correlation between the proportion of Assyrians/Chaldeans/Syriacs and percentage of single father households in the United States with a correlation coefficient (R) of -0.243 and weighted average of 2.0%. Similarly, the statistical analysis conducted on geographies consisting of 117,591,458 people shows a mild positive correlation between the proportion of Immigrants from Zimbabwe and percentage of single father households in the United States with a correlation coefficient (R) of 0.372 and weighted average of 2.2%, a difference of 14.4%.
Single Father Households Correlation Summary
| Measurement | Assyrian/Chaldean/Syriac | Immigrants from Zimbabwe |
| Minimum | 0.64% | 0.87% |
| Maximum | 6.3% | 5.0% |
| Range | 5.7% | 4.1% |
| Mean | 1.9% | 2.5% |
| Median | 1.9% | 2.4% |
| Interquartile 25% (IQ1) | 1.3% | 2.0% |
| Interquartile 75% (IQ3) | 2.3% | 2.9% |
| Interquartile Range (IQR) | 1.1% | 0.89% |
| Standard Deviation (Sample) | 0.89% | 0.90% |
| Standard Deviation (Population) | 0.88% | 0.89% |
Similar Demographics by Single Father Households
Demographics Similar to Assyrians/Chaldeans/Syriacs by Single Father Households
In terms of single father households, the demographic groups most similar to Assyrians/Chaldeans/Syriacs are Eastern European (2.0%, a difference of 0.14%), Immigrants from Croatia (2.0%, a difference of 0.15%), Immigrants from Russia (2.0%, a difference of 0.15%), Immigrants from South Central Asia (2.0%, a difference of 0.28%), and Immigrants from Japan (2.0%, a difference of 0.47%).
| Demographics | Rating | Rank | Single Father Households |
| Iranians | 100.0 /100 | #19 | Exceptional 1.9% |
| Thais | 100.0 /100 | #20 | Exceptional 1.9% |
| Immigrants | Albania | 100.0 /100 | #21 | Exceptional 1.9% |
| Immigrants | Latvia | 100.0 /100 | #22 | Exceptional 1.9% |
| Immigrants | Croatia | 100.0 /100 | #23 | Exceptional 2.0% |
| Immigrants | Russia | 100.0 /100 | #24 | Exceptional 2.0% |
| Eastern Europeans | 100.0 /100 | #25 | Exceptional 2.0% |
| Assyrians/Chaldeans/Syriacs | 100.0 /100 | #26 | Exceptional 2.0% |
| Immigrants | South Central Asia | 100.0 /100 | #27 | Exceptional 2.0% |
| Immigrants | Japan | 100.0 /100 | #28 | Exceptional 2.0% |
| Bulgarians | 100.0 /100 | #29 | Exceptional 2.0% |
| Cambodians | 100.0 /100 | #30 | Exceptional 2.0% |
| Israelis | 100.0 /100 | #31 | Exceptional 2.0% |
| Chinese | 100.0 /100 | #32 | Exceptional 2.0% |
| Turks | 100.0 /100 | #33 | Exceptional 2.0% |
Demographics Similar to Immigrants from Zimbabwe by Single Father Households
In terms of single father households, the demographic groups most similar to Immigrants from Zimbabwe are Northern European (2.2%, a difference of 0.080%), Slovak (2.2%, a difference of 0.11%), Slavic (2.2%, a difference of 0.26%), South American Indian (2.3%, a difference of 0.35%), and Senegalese (2.3%, a difference of 0.36%).
| Demographics | Rating | Rank | Single Father Households |
| West Indians | 94.1 /100 | #138 | Exceptional 2.2% |
| Brazilians | 92.8 /100 | #139 | Exceptional 2.2% |
| British | 92.8 /100 | #140 | Exceptional 2.2% |
| Laotians | 92.5 /100 | #141 | Exceptional 2.2% |
| Luxembourgers | 92.3 /100 | #142 | Exceptional 2.2% |
| Immigrants | Nepal | 92.1 /100 | #143 | Exceptional 2.2% |
| Slovaks | 90.7 /100 | #144 | Exceptional 2.2% |
| Immigrants | Zimbabwe | 90.2 /100 | #145 | Exceptional 2.2% |
| Northern Europeans | 89.8 /100 | #146 | Excellent 2.2% |
| Slavs | 88.9 /100 | #147 | Excellent 2.2% |
| South American Indians | 88.5 /100 | #148 | Excellent 2.3% |
| Senegalese | 88.4 /100 | #149 | Excellent 2.3% |
| Venezuelans | 86.2 /100 | #150 | Excellent 2.3% |
| Immigrants | Syria | 84.8 /100 | #151 | Excellent 2.3% |
| Immigrants | Venezuela | 83.2 /100 | #152 | Excellent 2.3% |