Assyrian/Chaldean/Syriac vs Welsh Single Father Households
COMPARE
Assyrian/Chaldean/Syriac
Welsh
Single Father Households
Single Father Households Comparison
Assyrians/Chaldeans/Syriacs
Welsh
2.0%
SINGLE FATHER HOUSEHOLDS
100.0/ 100
METRIC RATING
26th/ 347
METRIC RANK
2.3%
SINGLE FATHER HOUSEHOLDS
44.0/ 100
METRIC RATING
179th/ 347
METRIC RANK
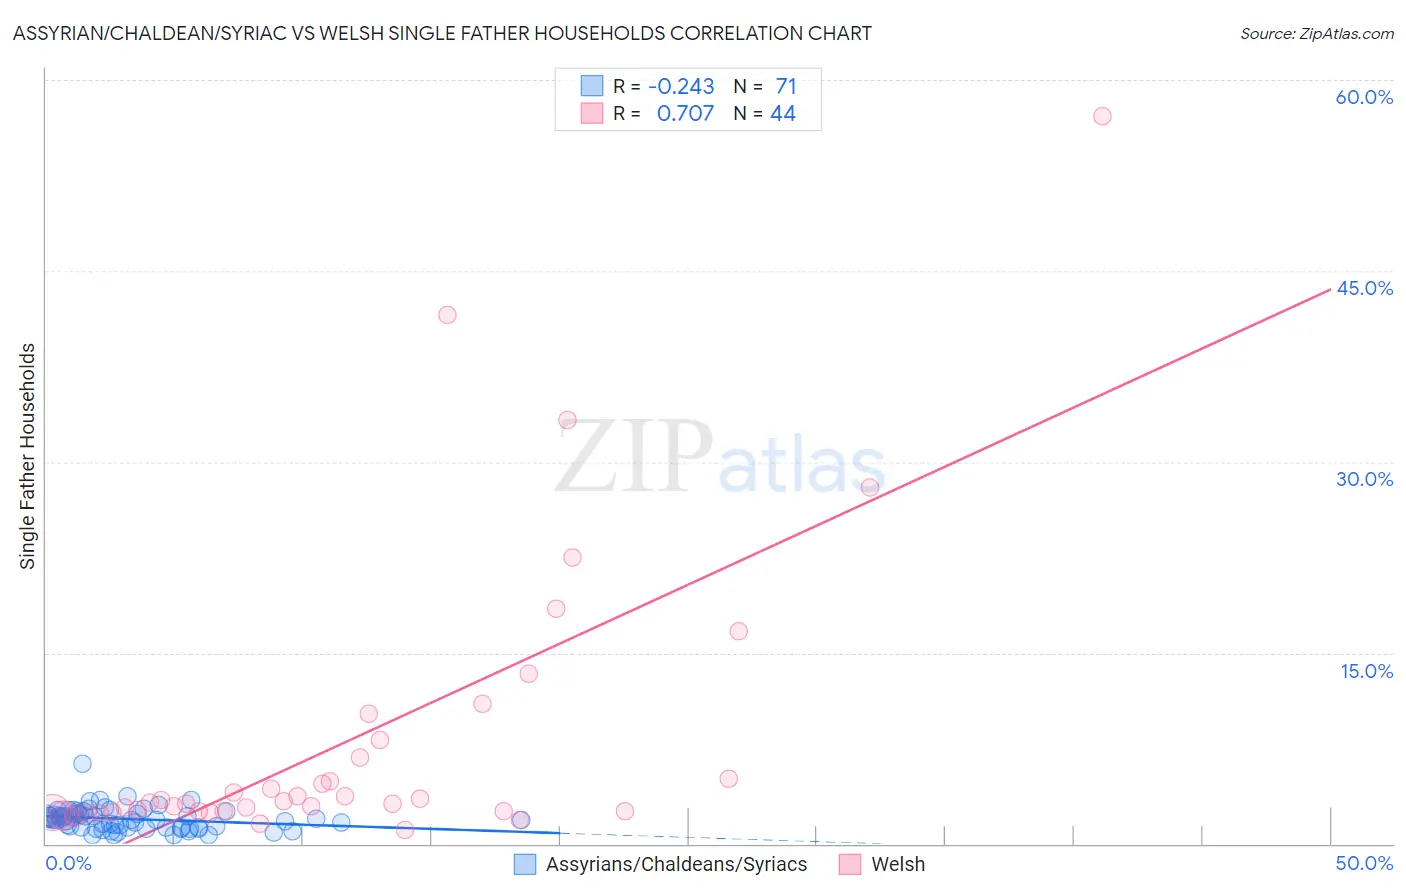
Assyrian/Chaldean/Syriac vs Welsh Single Father Households Correlation Chart
The statistical analysis conducted on geographies consisting of 110,024,022 people shows a weak negative correlation between the proportion of Assyrians/Chaldeans/Syriacs and percentage of single father households in the United States with a correlation coefficient (R) of -0.243 and weighted average of 2.0%. Similarly, the statistical analysis conducted on geographies consisting of 518,370,143 people shows a strong positive correlation between the proportion of Welsh and percentage of single father households in the United States with a correlation coefficient (R) of 0.707 and weighted average of 2.3%, a difference of 19.8%.
Single Father Households Correlation Summary
| Measurement | Assyrian/Chaldean/Syriac | Welsh |
| Minimum | 0.64% | 1.1% |
| Maximum | 6.3% | 57.1% |
| Range | 5.7% | 56.0% |
| Mean | 1.9% | 8.3% |
| Median | 1.9% | 3.3% |
| Interquartile 25% (IQ1) | 1.3% | 2.6% |
| Interquartile 75% (IQ3) | 2.3% | 7.5% |
| Interquartile Range (IQR) | 1.1% | 4.9% |
| Standard Deviation (Sample) | 0.89% | 11.7% |
| Standard Deviation (Population) | 0.88% | 11.5% |
Similar Demographics by Single Father Households
Demographics Similar to Assyrians/Chaldeans/Syriacs by Single Father Households
In terms of single father households, the demographic groups most similar to Assyrians/Chaldeans/Syriacs are Eastern European (2.0%, a difference of 0.14%), Immigrants from Croatia (2.0%, a difference of 0.15%), Immigrants from Russia (2.0%, a difference of 0.15%), Immigrants from South Central Asia (2.0%, a difference of 0.28%), and Immigrants from Japan (2.0%, a difference of 0.47%).
| Demographics | Rating | Rank | Single Father Households |
| Iranians | 100.0 /100 | #19 | Exceptional 1.9% |
| Thais | 100.0 /100 | #20 | Exceptional 1.9% |
| Immigrants | Albania | 100.0 /100 | #21 | Exceptional 1.9% |
| Immigrants | Latvia | 100.0 /100 | #22 | Exceptional 1.9% |
| Immigrants | Croatia | 100.0 /100 | #23 | Exceptional 2.0% |
| Immigrants | Russia | 100.0 /100 | #24 | Exceptional 2.0% |
| Eastern Europeans | 100.0 /100 | #25 | Exceptional 2.0% |
| Assyrians/Chaldeans/Syriacs | 100.0 /100 | #26 | Exceptional 2.0% |
| Immigrants | South Central Asia | 100.0 /100 | #27 | Exceptional 2.0% |
| Immigrants | Japan | 100.0 /100 | #28 | Exceptional 2.0% |
| Bulgarians | 100.0 /100 | #29 | Exceptional 2.0% |
| Cambodians | 100.0 /100 | #30 | Exceptional 2.0% |
| Israelis | 100.0 /100 | #31 | Exceptional 2.0% |
| Chinese | 100.0 /100 | #32 | Exceptional 2.0% |
| Turks | 100.0 /100 | #33 | Exceptional 2.0% |
Demographics Similar to Welsh by Single Father Households
In terms of single father households, the demographic groups most similar to Welsh are Costa Rican (2.3%, a difference of 0.0%), Yugoslavian (2.3%, a difference of 0.010%), Jamaican (2.3%, a difference of 0.040%), Belgian (2.3%, a difference of 0.060%), and Immigrants from Panama (2.4%, a difference of 0.16%).
| Demographics | Rating | Rank | Single Father Households |
| Czechoslovakians | 58.9 /100 | #172 | Average 2.3% |
| Celtics | 55.4 /100 | #173 | Average 2.3% |
| Afghans | 50.0 /100 | #174 | Average 2.3% |
| Immigrants | Jamaica | 49.1 /100 | #175 | Average 2.3% |
| Danes | 48.2 /100 | #176 | Average 2.3% |
| Colombians | 48.0 /100 | #177 | Average 2.3% |
| Costa Ricans | 44.1 /100 | #178 | Average 2.3% |
| Welsh | 44.0 /100 | #179 | Average 2.3% |
| Yugoslavians | 43.9 /100 | #180 | Average 2.3% |
| Jamaicans | 43.5 /100 | #181 | Average 2.3% |
| Belgians | 43.3 /100 | #182 | Average 2.3% |
| Immigrants | Panama | 41.8 /100 | #183 | Average 2.4% |
| Sri Lankans | 41.8 /100 | #184 | Average 2.4% |
| Nigerians | 41.0 /100 | #185 | Average 2.4% |
| Immigrants | Bosnia and Herzegovina | 40.4 /100 | #186 | Average 2.4% |