Assyrian/Chaldean/Syriac vs Immigrants from Korea Single Father Households
COMPARE
Assyrian/Chaldean/Syriac
Immigrants from Korea
Single Father Households
Single Father Households Comparison
Assyrians/Chaldeans/Syriacs
Immigrants from Korea
2.0%
SINGLE FATHER HOUSEHOLDS
100.0/ 100
METRIC RATING
26th/ 347
METRIC RANK
2.0%
SINGLE FATHER HOUSEHOLDS
99.9/ 100
METRIC RATING
54th/ 347
METRIC RANK
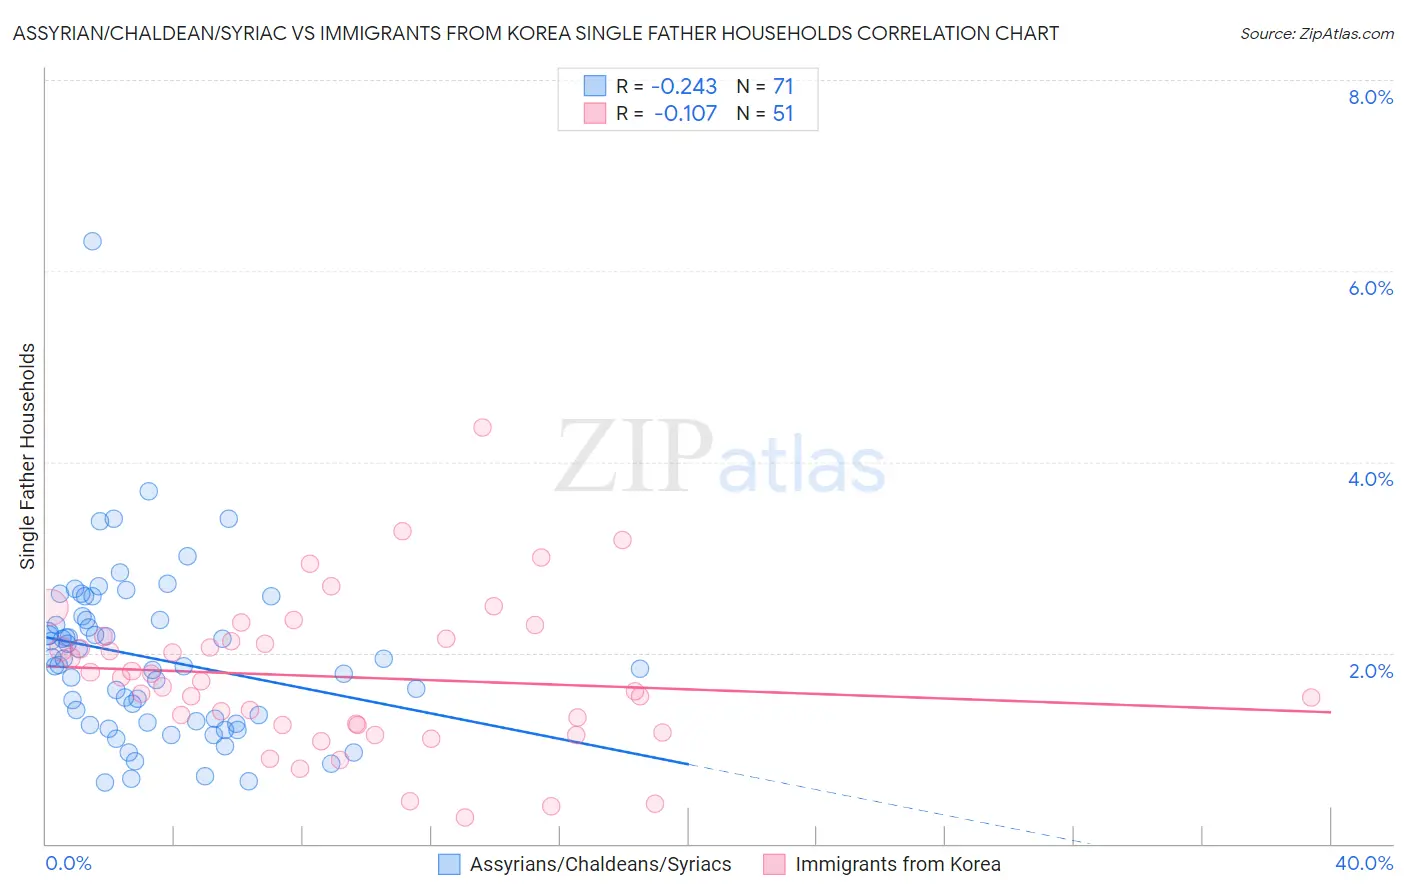
Assyrian/Chaldean/Syriac vs Immigrants from Korea Single Father Households Correlation Chart
The statistical analysis conducted on geographies consisting of 110,024,022 people shows a weak negative correlation between the proportion of Assyrians/Chaldeans/Syriacs and percentage of single father households in the United States with a correlation coefficient (R) of -0.243 and weighted average of 2.0%. Similarly, the statistical analysis conducted on geographies consisting of 412,362,512 people shows a poor negative correlation between the proportion of Immigrants from Korea and percentage of single father households in the United States with a correlation coefficient (R) of -0.107 and weighted average of 2.0%, a difference of 3.4%.
Single Father Households Correlation Summary
| Measurement | Assyrian/Chaldean/Syriac | Immigrants from Korea |
| Minimum | 0.64% | 0.27% |
| Maximum | 6.3% | 4.4% |
| Range | 5.7% | 4.1% |
| Mean | 1.9% | 1.7% |
| Median | 1.9% | 1.7% |
| Interquartile 25% (IQ1) | 1.3% | 1.2% |
| Interquartile 75% (IQ3) | 2.3% | 2.1% |
| Interquartile Range (IQR) | 1.1% | 0.91% |
| Standard Deviation (Sample) | 0.89% | 0.80% |
| Standard Deviation (Population) | 0.88% | 0.79% |
Similar Demographics by Single Father Households
Demographics Similar to Assyrians/Chaldeans/Syriacs by Single Father Households
In terms of single father households, the demographic groups most similar to Assyrians/Chaldeans/Syriacs are Eastern European (2.0%, a difference of 0.14%), Immigrants from Croatia (2.0%, a difference of 0.15%), Immigrants from Russia (2.0%, a difference of 0.15%), Immigrants from South Central Asia (2.0%, a difference of 0.28%), and Immigrants from Japan (2.0%, a difference of 0.47%).
| Demographics | Rating | Rank | Single Father Households |
| Iranians | 100.0 /100 | #19 | Exceptional 1.9% |
| Thais | 100.0 /100 | #20 | Exceptional 1.9% |
| Immigrants | Albania | 100.0 /100 | #21 | Exceptional 1.9% |
| Immigrants | Latvia | 100.0 /100 | #22 | Exceptional 1.9% |
| Immigrants | Croatia | 100.0 /100 | #23 | Exceptional 2.0% |
| Immigrants | Russia | 100.0 /100 | #24 | Exceptional 2.0% |
| Eastern Europeans | 100.0 /100 | #25 | Exceptional 2.0% |
| Assyrians/Chaldeans/Syriacs | 100.0 /100 | #26 | Exceptional 2.0% |
| Immigrants | South Central Asia | 100.0 /100 | #27 | Exceptional 2.0% |
| Immigrants | Japan | 100.0 /100 | #28 | Exceptional 2.0% |
| Bulgarians | 100.0 /100 | #29 | Exceptional 2.0% |
| Cambodians | 100.0 /100 | #30 | Exceptional 2.0% |
| Israelis | 100.0 /100 | #31 | Exceptional 2.0% |
| Chinese | 100.0 /100 | #32 | Exceptional 2.0% |
| Turks | 100.0 /100 | #33 | Exceptional 2.0% |
Demographics Similar to Immigrants from Korea by Single Father Households
In terms of single father households, the demographic groups most similar to Immigrants from Korea are Immigrants from France (2.0%, a difference of 0.050%), Immigrants from Norway (2.0%, a difference of 0.080%), Immigrants from Northern Europe (2.0%, a difference of 0.14%), Immigrants from Europe (2.0%, a difference of 0.28%), and Burmese (2.0%, a difference of 0.34%).
| Demographics | Rating | Rank | Single Father Households |
| Immigrants | Ukraine | 99.9 /100 | #47 | Exceptional 2.0% |
| Immigrants | Kazakhstan | 99.9 /100 | #48 | Exceptional 2.0% |
| Immigrants | Serbia | 99.9 /100 | #49 | Exceptional 2.0% |
| Immigrants | Switzerland | 99.9 /100 | #50 | Exceptional 2.0% |
| Immigrants | Poland | 99.9 /100 | #51 | Exceptional 2.0% |
| Immigrants | Europe | 99.9 /100 | #52 | Exceptional 2.0% |
| Immigrants | Northern Europe | 99.9 /100 | #53 | Exceptional 2.0% |
| Immigrants | Korea | 99.9 /100 | #54 | Exceptional 2.0% |
| Immigrants | France | 99.9 /100 | #55 | Exceptional 2.0% |
| Immigrants | Norway | 99.9 /100 | #56 | Exceptional 2.0% |
| Burmese | 99.9 /100 | #57 | Exceptional 2.0% |
| Immigrants | Czechoslovakia | 99.9 /100 | #58 | Exceptional 2.0% |
| Immigrants | North Macedonia | 99.9 /100 | #59 | Exceptional 2.0% |
| Immigrants | Austria | 99.9 /100 | #60 | Exceptional 2.0% |
| Vietnamese | 99.9 /100 | #61 | Exceptional 2.0% |