Assyrian/Chaldean/Syriac vs Croatian Single Father Households
COMPARE
Assyrian/Chaldean/Syriac
Croatian
Single Father Households
Single Father Households Comparison
Assyrians/Chaldeans/Syriacs
Croatians
2.0%
SINGLE FATHER HOUSEHOLDS
100.0/ 100
METRIC RATING
26th/ 347
METRIC RANK
2.1%
SINGLE FATHER HOUSEHOLDS
99.3/ 100
METRIC RATING
93rd/ 347
METRIC RANK
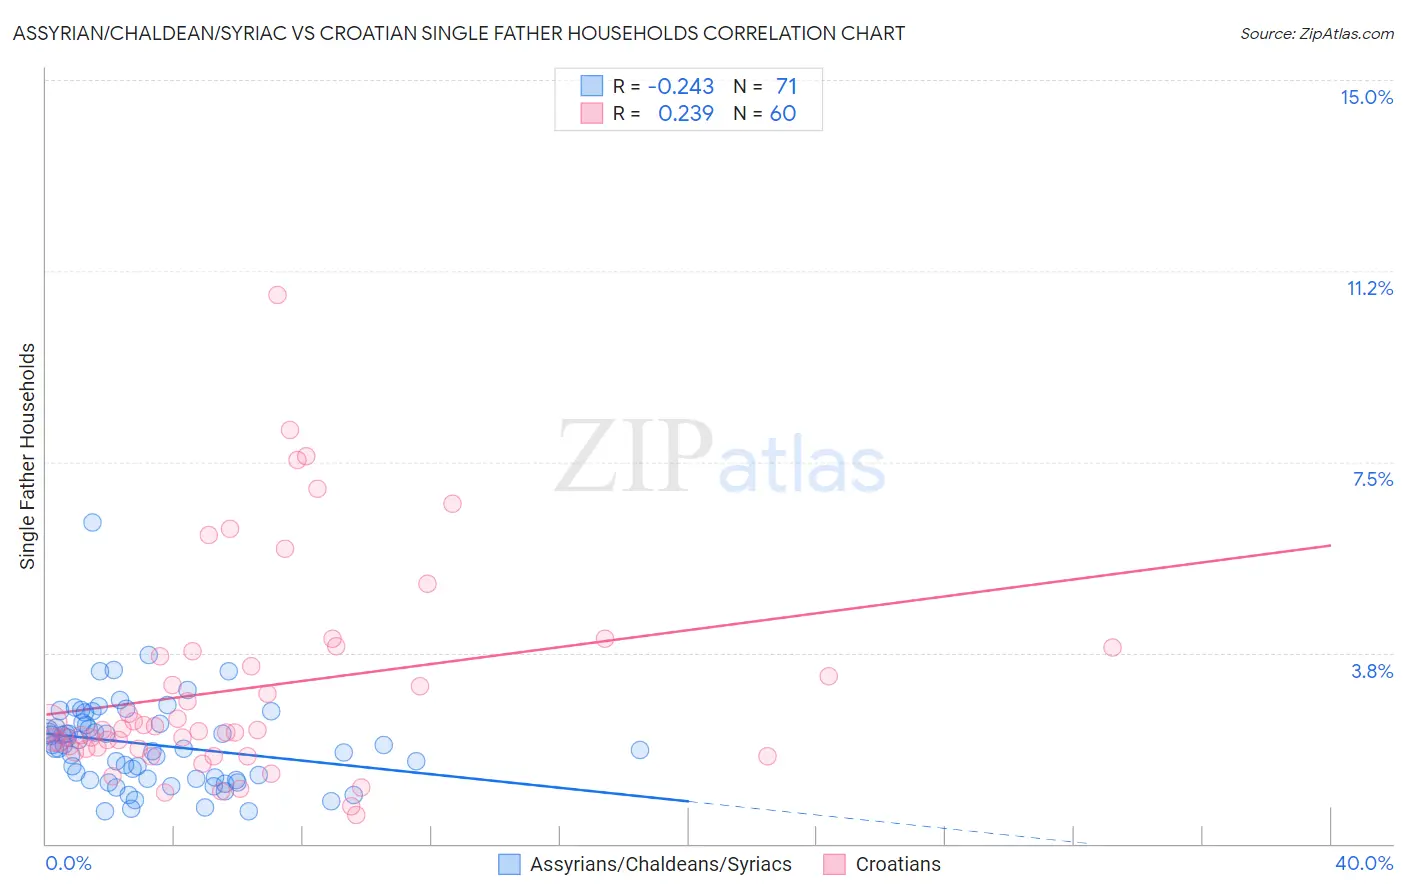
Assyrian/Chaldean/Syriac vs Croatian Single Father Households Correlation Chart
The statistical analysis conducted on geographies consisting of 110,024,022 people shows a weak negative correlation between the proportion of Assyrians/Chaldeans/Syriacs and percentage of single father households in the United States with a correlation coefficient (R) of -0.243 and weighted average of 2.0%. Similarly, the statistical analysis conducted on geographies consisting of 372,052,668 people shows a weak positive correlation between the proportion of Croatians and percentage of single father households in the United States with a correlation coefficient (R) of 0.239 and weighted average of 2.1%, a difference of 8.4%.
Single Father Households Correlation Summary
| Measurement | Assyrian/Chaldean/Syriac | Croatian |
| Minimum | 0.64% | 0.56% |
| Maximum | 6.3% | 10.8% |
| Range | 5.7% | 10.2% |
| Mean | 1.9% | 3.1% |
| Median | 1.9% | 2.2% |
| Interquartile 25% (IQ1) | 1.3% | 1.9% |
| Interquartile 75% (IQ3) | 2.3% | 3.7% |
| Interquartile Range (IQR) | 1.1% | 1.9% |
| Standard Deviation (Sample) | 0.89% | 2.1% |
| Standard Deviation (Population) | 0.88% | 2.1% |
Similar Demographics by Single Father Households
Demographics Similar to Assyrians/Chaldeans/Syriacs by Single Father Households
In terms of single father households, the demographic groups most similar to Assyrians/Chaldeans/Syriacs are Eastern European (2.0%, a difference of 0.14%), Immigrants from Croatia (2.0%, a difference of 0.15%), Immigrants from Russia (2.0%, a difference of 0.15%), Immigrants from South Central Asia (2.0%, a difference of 0.28%), and Immigrants from Japan (2.0%, a difference of 0.47%).
| Demographics | Rating | Rank | Single Father Households |
| Iranians | 100.0 /100 | #19 | Exceptional 1.9% |
| Thais | 100.0 /100 | #20 | Exceptional 1.9% |
| Immigrants | Albania | 100.0 /100 | #21 | Exceptional 1.9% |
| Immigrants | Latvia | 100.0 /100 | #22 | Exceptional 1.9% |
| Immigrants | Croatia | 100.0 /100 | #23 | Exceptional 2.0% |
| Immigrants | Russia | 100.0 /100 | #24 | Exceptional 2.0% |
| Eastern Europeans | 100.0 /100 | #25 | Exceptional 2.0% |
| Assyrians/Chaldeans/Syriacs | 100.0 /100 | #26 | Exceptional 2.0% |
| Immigrants | South Central Asia | 100.0 /100 | #27 | Exceptional 2.0% |
| Immigrants | Japan | 100.0 /100 | #28 | Exceptional 2.0% |
| Bulgarians | 100.0 /100 | #29 | Exceptional 2.0% |
| Cambodians | 100.0 /100 | #30 | Exceptional 2.0% |
| Israelis | 100.0 /100 | #31 | Exceptional 2.0% |
| Chinese | 100.0 /100 | #32 | Exceptional 2.0% |
| Turks | 100.0 /100 | #33 | Exceptional 2.0% |
Demographics Similar to Croatians by Single Father Households
In terms of single father households, the demographic groups most similar to Croatians are Ukrainian (2.1%, a difference of 0.0%), Romanian (2.1%, a difference of 0.11%), Immigrants from Guyana (2.1%, a difference of 0.20%), Bermudan (2.1%, a difference of 0.23%), and Arab (2.1%, a difference of 0.37%).
| Demographics | Rating | Rank | Single Father Households |
| Asians | 99.6 /100 | #86 | Exceptional 2.1% |
| Lithuanians | 99.5 /100 | #87 | Exceptional 2.1% |
| Bhutanese | 99.5 /100 | #88 | Exceptional 2.1% |
| Immigrants | Armenia | 99.5 /100 | #89 | Exceptional 2.1% |
| Immigrants | Pakistan | 99.5 /100 | #90 | Exceptional 2.1% |
| Immigrants | Guyana | 99.4 /100 | #91 | Exceptional 2.1% |
| Romanians | 99.4 /100 | #92 | Exceptional 2.1% |
| Croatians | 99.3 /100 | #93 | Exceptional 2.1% |
| Ukrainians | 99.3 /100 | #94 | Exceptional 2.1% |
| Bermudans | 99.2 /100 | #95 | Exceptional 2.1% |
| Arabs | 99.2 /100 | #96 | Exceptional 2.1% |
| Immigrants | Moldova | 99.1 /100 | #97 | Exceptional 2.1% |
| Guyanese | 99.1 /100 | #98 | Exceptional 2.1% |
| South Africans | 99.1 /100 | #99 | Exceptional 2.1% |
| Immigrants | Northern Africa | 99.0 /100 | #100 | Exceptional 2.1% |