Assyrian/Chaldean/Syriac vs Immigrants from Chile Single Father Households
COMPARE
Assyrian/Chaldean/Syriac
Immigrants from Chile
Single Father Households
Single Father Households Comparison
Assyrians/Chaldeans/Syriacs
Immigrants from Chile
2.0%
SINGLE FATHER HOUSEHOLDS
100.0/ 100
METRIC RATING
26th/ 347
METRIC RANK
2.2%
SINGLE FATHER HOUSEHOLDS
96.7/ 100
METRIC RATING
130th/ 347
METRIC RANK
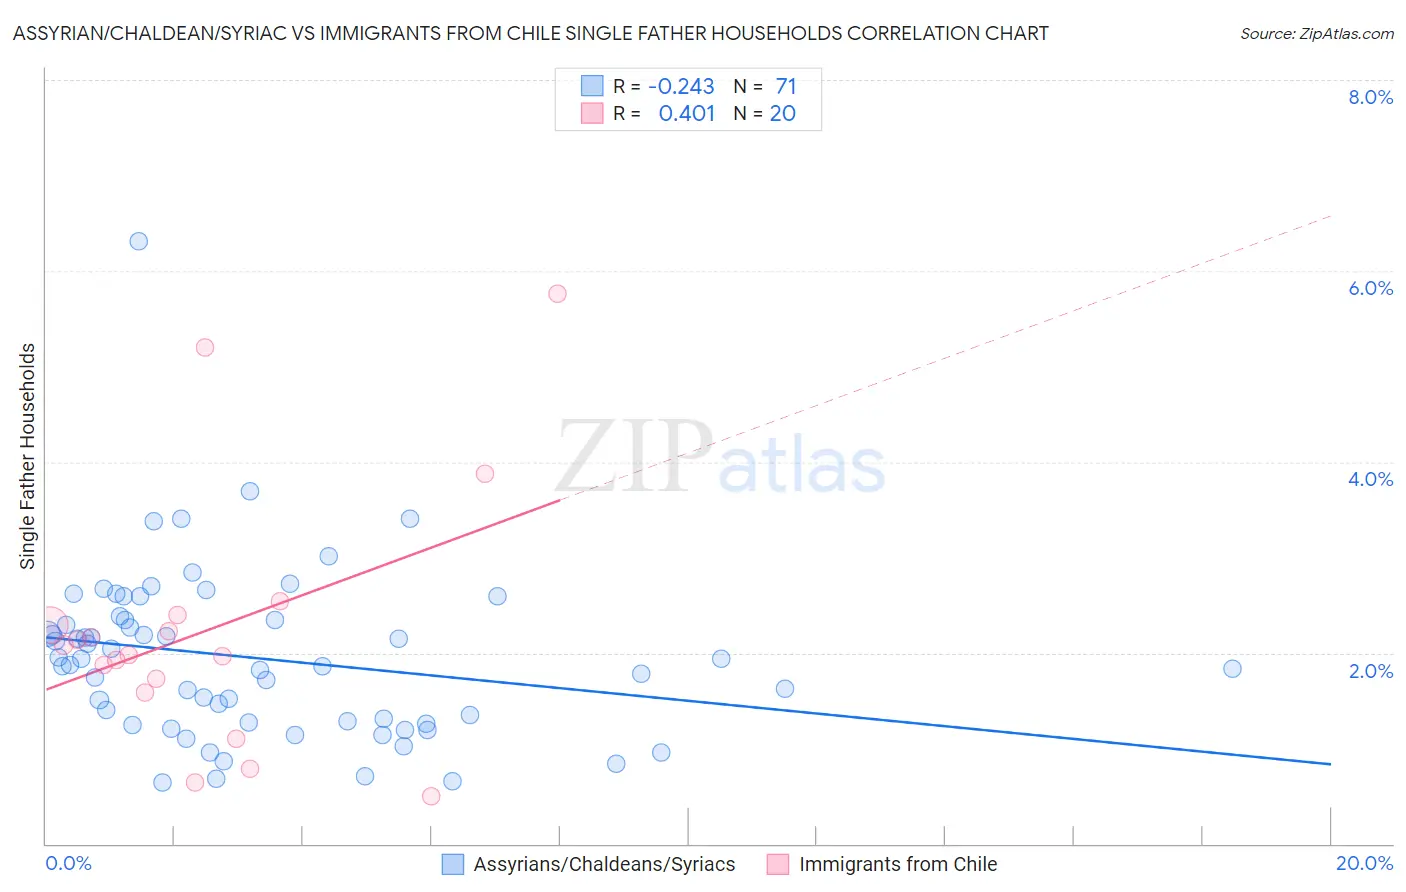
Assyrian/Chaldean/Syriac vs Immigrants from Chile Single Father Households Correlation Chart
The statistical analysis conducted on geographies consisting of 110,024,022 people shows a weak negative correlation between the proportion of Assyrians/Chaldeans/Syriacs and percentage of single father households in the United States with a correlation coefficient (R) of -0.243 and weighted average of 2.0%. Similarly, the statistical analysis conducted on geographies consisting of 217,839,905 people shows a moderate positive correlation between the proportion of Immigrants from Chile and percentage of single father households in the United States with a correlation coefficient (R) of 0.401 and weighted average of 2.2%, a difference of 11.9%.
Single Father Households Correlation Summary
| Measurement | Assyrian/Chaldean/Syriac | Immigrants from Chile |
| Minimum | 0.64% | 0.50% |
| Maximum | 6.3% | 5.8% |
| Range | 5.7% | 5.3% |
| Mean | 1.9% | 2.2% |
| Median | 1.9% | 2.0% |
| Interquartile 25% (IQ1) | 1.3% | 1.7% |
| Interquartile 75% (IQ3) | 2.3% | 2.3% |
| Interquartile Range (IQR) | 1.1% | 0.69% |
| Standard Deviation (Sample) | 0.89% | 1.3% |
| Standard Deviation (Population) | 0.88% | 1.3% |
Similar Demographics by Single Father Households
Demographics Similar to Assyrians/Chaldeans/Syriacs by Single Father Households
In terms of single father households, the demographic groups most similar to Assyrians/Chaldeans/Syriacs are Eastern European (2.0%, a difference of 0.14%), Immigrants from Croatia (2.0%, a difference of 0.15%), Immigrants from Russia (2.0%, a difference of 0.15%), Immigrants from South Central Asia (2.0%, a difference of 0.28%), and Immigrants from Japan (2.0%, a difference of 0.47%).
| Demographics | Rating | Rank | Single Father Households |
| Iranians | 100.0 /100 | #19 | Exceptional 1.9% |
| Thais | 100.0 /100 | #20 | Exceptional 1.9% |
| Immigrants | Albania | 100.0 /100 | #21 | Exceptional 1.9% |
| Immigrants | Latvia | 100.0 /100 | #22 | Exceptional 1.9% |
| Immigrants | Croatia | 100.0 /100 | #23 | Exceptional 2.0% |
| Immigrants | Russia | 100.0 /100 | #24 | Exceptional 2.0% |
| Eastern Europeans | 100.0 /100 | #25 | Exceptional 2.0% |
| Assyrians/Chaldeans/Syriacs | 100.0 /100 | #26 | Exceptional 2.0% |
| Immigrants | South Central Asia | 100.0 /100 | #27 | Exceptional 2.0% |
| Immigrants | Japan | 100.0 /100 | #28 | Exceptional 2.0% |
| Bulgarians | 100.0 /100 | #29 | Exceptional 2.0% |
| Cambodians | 100.0 /100 | #30 | Exceptional 2.0% |
| Israelis | 100.0 /100 | #31 | Exceptional 2.0% |
| Chinese | 100.0 /100 | #32 | Exceptional 2.0% |
| Turks | 100.0 /100 | #33 | Exceptional 2.0% |
Demographics Similar to Immigrants from Chile by Single Father Households
In terms of single father households, the demographic groups most similar to Immigrants from Chile are Immigrants from Jordan (2.2%, a difference of 0.060%), Polish (2.2%, a difference of 0.070%), Serbian (2.2%, a difference of 0.11%), Immigrants from England (2.2%, a difference of 0.12%), and Moroccan (2.2%, a difference of 0.17%).
| Demographics | Rating | Rank | Single Father Households |
| Immigrants | Yemen | 97.5 /100 | #123 | Exceptional 2.2% |
| British West Indians | 97.4 /100 | #124 | Exceptional 2.2% |
| Immigrants | Indonesia | 97.4 /100 | #125 | Exceptional 2.2% |
| Moroccans | 96.9 /100 | #126 | Exceptional 2.2% |
| Jordanians | 96.9 /100 | #127 | Exceptional 2.2% |
| Immigrants | England | 96.8 /100 | #128 | Exceptional 2.2% |
| Serbians | 96.8 /100 | #129 | Exceptional 2.2% |
| Immigrants | Chile | 96.7 /100 | #130 | Exceptional 2.2% |
| Immigrants | Jordan | 96.6 /100 | #131 | Exceptional 2.2% |
| Poles | 96.5 /100 | #132 | Exceptional 2.2% |
| Taiwanese | 96.3 /100 | #133 | Exceptional 2.2% |
| Zimbabweans | 95.1 /100 | #134 | Exceptional 2.2% |
| Syrians | 94.8 /100 | #135 | Exceptional 2.2% |
| Chileans | 94.5 /100 | #136 | Exceptional 2.2% |
| Austrians | 94.2 /100 | #137 | Exceptional 2.2% |