Scotch-Irish vs Filipino Self-Care Disability
COMPARE
Scotch-Irish
Filipino
Self-Care Disability
Self-Care Disability Comparison
Scotch-Irish
Filipinos
2.6%
SELF-CARE DISABILITY
4.1/ 100
METRIC RATING
218th/ 347
METRIC RANK
2.2%
SELF-CARE DISABILITY
100.0/ 100
METRIC RATING
6th/ 347
METRIC RANK
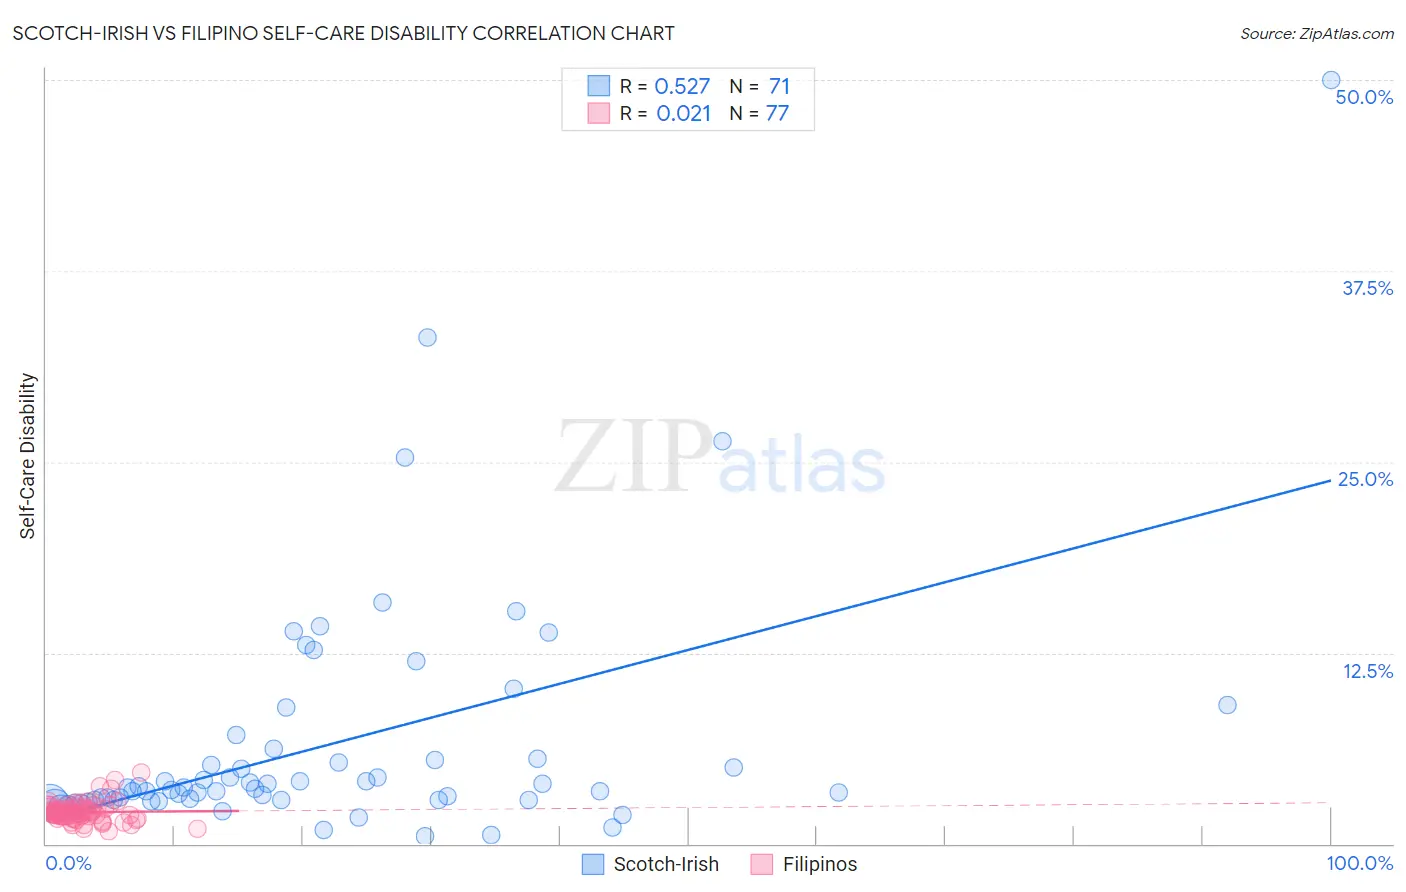
Scotch-Irish vs Filipino Self-Care Disability Correlation Chart
The statistical analysis conducted on geographies consisting of 547,085,910 people shows a substantial positive correlation between the proportion of Scotch-Irish and percentage of population with self-care disability in the United States with a correlation coefficient (R) of 0.527 and weighted average of 2.6%. Similarly, the statistical analysis conducted on geographies consisting of 254,069,032 people shows no correlation between the proportion of Filipinos and percentage of population with self-care disability in the United States with a correlation coefficient (R) of 0.021 and weighted average of 2.2%, a difference of 18.7%.
Self-Care Disability Correlation Summary
| Measurement | Scotch-Irish | Filipino |
| Minimum | 0.47% | 0.79% |
| Maximum | 50.0% | 4.7% |
| Range | 49.5% | 3.9% |
| Mean | 6.5% | 2.1% |
| Median | 3.6% | 2.0% |
| Interquartile 25% (IQ1) | 2.8% | 1.8% |
| Interquartile 75% (IQ3) | 5.6% | 2.3% |
| Interquartile Range (IQR) | 2.7% | 0.54% |
| Standard Deviation (Sample) | 8.0% | 0.64% |
| Standard Deviation (Population) | 7.9% | 0.64% |
Similar Demographics by Self-Care Disability
Demographics Similar to Scotch-Irish by Self-Care Disability
In terms of self-care disability, the demographic groups most similar to Scotch-Irish are Immigrants from Moldova (2.6%, a difference of 0.030%), Subsaharan African (2.6%, a difference of 0.040%), Celtic (2.6%, a difference of 0.070%), Honduran (2.6%, a difference of 0.080%), and White/Caucasian (2.6%, a difference of 0.090%).
| Demographics | Rating | Rank | Self-Care Disability |
| Native Hawaiians | 5.1 /100 | #211 | Tragic 2.6% |
| Samoans | 5.1 /100 | #212 | Tragic 2.6% |
| Ecuadorians | 4.7 /100 | #213 | Tragic 2.6% |
| Immigrants | Honduras | 4.7 /100 | #214 | Tragic 2.6% |
| Immigrants | Thailand | 4.5 /100 | #215 | Tragic 2.6% |
| Whites/Caucasians | 4.4 /100 | #216 | Tragic 2.6% |
| Celtics | 4.4 /100 | #217 | Tragic 2.6% |
| Scotch-Irish | 4.1 /100 | #218 | Tragic 2.6% |
| Immigrants | Moldova | 4.0 /100 | #219 | Tragic 2.6% |
| Sub-Saharan Africans | 4.0 /100 | #220 | Tragic 2.6% |
| Hondurans | 3.8 /100 | #221 | Tragic 2.6% |
| Spaniards | 3.8 /100 | #222 | Tragic 2.6% |
| French Canadians | 3.8 /100 | #223 | Tragic 2.6% |
| Osage | 3.6 /100 | #224 | Tragic 2.6% |
| Iraqis | 3.2 /100 | #225 | Tragic 2.6% |
Demographics Similar to Filipinos by Self-Care Disability
In terms of self-care disability, the demographic groups most similar to Filipinos are Immigrants from Bolivia (2.2%, a difference of 0.21%), Zimbabwean (2.2%, a difference of 0.25%), Bolivian (2.2%, a difference of 0.26%), Immigrants from Nepal (2.2%, a difference of 0.39%), and Immigrants from Singapore (2.1%, a difference of 1.2%).
| Demographics | Rating | Rank | Self-Care Disability |
| Yup'ik | 100.0 /100 | #1 | Exceptional 1.9% |
| Immigrants | India | 100.0 /100 | #2 | Exceptional 2.0% |
| Thais | 100.0 /100 | #3 | Exceptional 2.1% |
| Immigrants | Singapore | 100.0 /100 | #4 | Exceptional 2.1% |
| Zimbabweans | 100.0 /100 | #5 | Exceptional 2.2% |
| Filipinos | 100.0 /100 | #6 | Exceptional 2.2% |
| Immigrants | Bolivia | 100.0 /100 | #7 | Exceptional 2.2% |
| Bolivians | 100.0 /100 | #8 | Exceptional 2.2% |
| Immigrants | Nepal | 100.0 /100 | #9 | Exceptional 2.2% |
| Sudanese | 100.0 /100 | #10 | Exceptional 2.2% |
| Immigrants | South Central Asia | 100.0 /100 | #11 | Exceptional 2.2% |
| Immigrants | Ethiopia | 100.0 /100 | #12 | Exceptional 2.2% |
| Ethiopians | 100.0 /100 | #13 | Exceptional 2.2% |
| Luxembourgers | 100.0 /100 | #14 | Exceptional 2.2% |
| Okinawans | 100.0 /100 | #15 | Exceptional 2.2% |