Immigrants from Panama vs Filipino Births to Unmarried Women
COMPARE
Immigrants from Panama
Filipino
Births to Unmarried Women
Births to Unmarried Women Comparison
Immigrants from Panama
Filipinos
34.2%
BIRTHS TO UNMARRIED WOMEN
3.3/ 100
METRIC RATING
227th/ 347
METRIC RANK
23.0%
BIRTHS TO UNMARRIED WOMEN
100.0/ 100
METRIC RATING
3rd/ 347
METRIC RANK
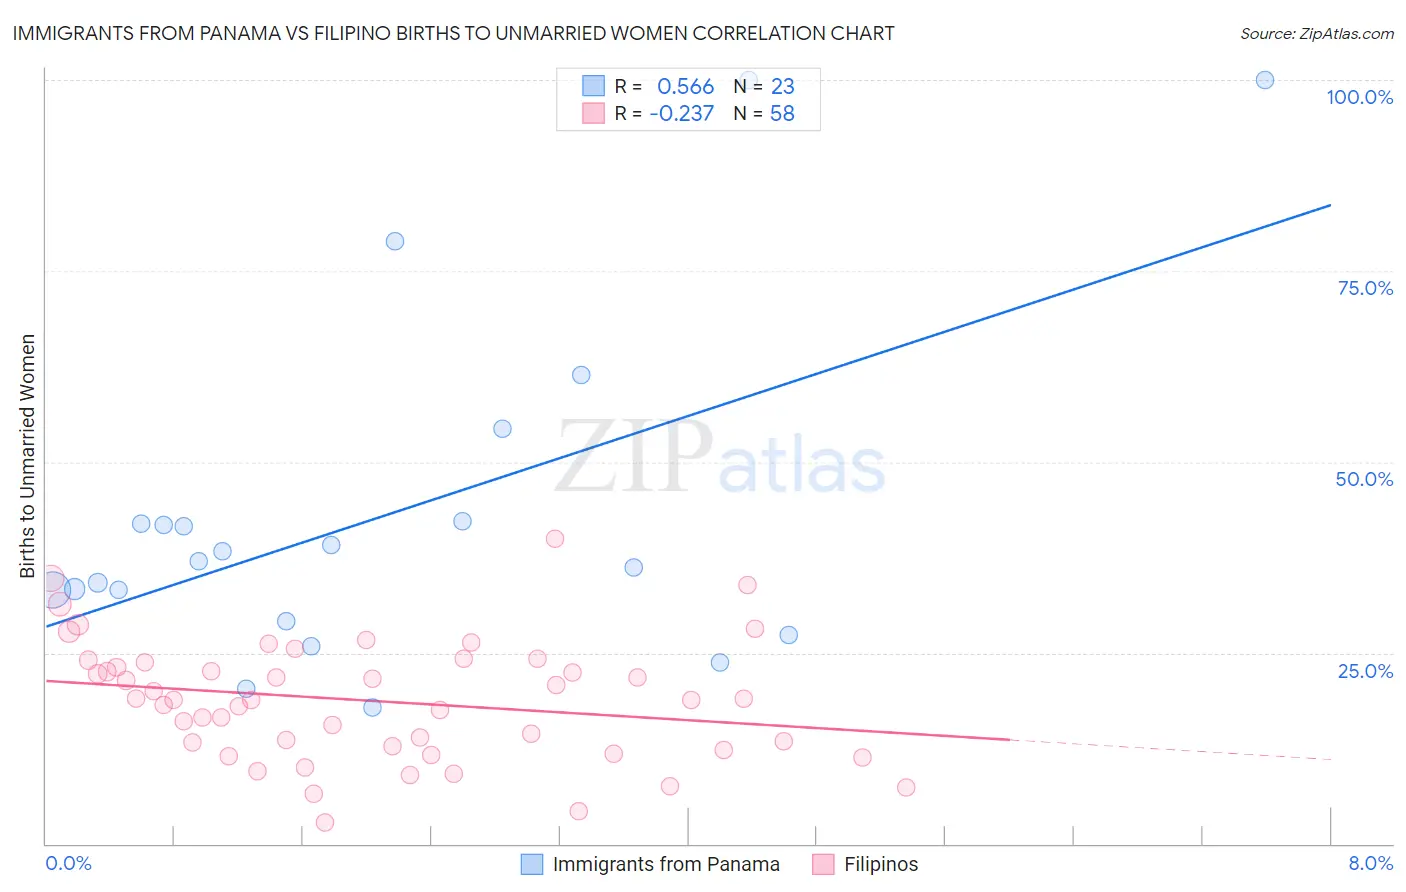
Immigrants from Panama vs Filipino Births to Unmarried Women Correlation Chart
The statistical analysis conducted on geographies consisting of 213,926,652 people shows a substantial positive correlation between the proportion of Immigrants from Panama and percentage of births to unmarried women in the United States with a correlation coefficient (R) of 0.566 and weighted average of 34.2%. Similarly, the statistical analysis conducted on geographies consisting of 239,363,717 people shows a weak negative correlation between the proportion of Filipinos and percentage of births to unmarried women in the United States with a correlation coefficient (R) of -0.237 and weighted average of 23.0%, a difference of 48.8%.
Births to Unmarried Women Correlation Summary
| Measurement | Immigrants from Panama | Filipino |
| Minimum | 17.8% | 2.8% |
| Maximum | 100.0% | 40.0% |
| Range | 82.2% | 37.2% |
| Mean | 43.1% | 18.7% |
| Median | 36.9% | 18.9% |
| Interquartile 25% (IQ1) | 29.1% | 12.7% |
| Interquartile 75% (IQ3) | 42.2% | 23.7% |
| Interquartile Range (IQR) | 13.1% | 11.0% |
| Standard Deviation (Sample) | 22.4% | 7.8% |
| Standard Deviation (Population) | 21.9% | 7.7% |
Similar Demographics by Births to Unmarried Women
Demographics Similar to Immigrants from Panama by Births to Unmarried Women
In terms of births to unmarried women, the demographic groups most similar to Immigrants from Panama are Delaware (34.2%, a difference of 0.010%), Panamanian (34.2%, a difference of 0.030%), Immigrants from Sierra Leone (34.2%, a difference of 0.14%), Ghanaian (34.3%, a difference of 0.17%), and Native Hawaiian (34.3%, a difference of 0.31%).
| Demographics | Rating | Rank | Births to Unmarried Women |
| Portuguese | 5.4 /100 | #220 | Tragic 33.8% |
| Malaysians | 5.0 /100 | #221 | Tragic 33.9% |
| Immigrants | Uruguay | 4.8 /100 | #222 | Tragic 33.9% |
| Pennsylvania Germans | 4.3 /100 | #223 | Tragic 34.0% |
| Immigrants | Laos | 4.3 /100 | #224 | Tragic 34.0% |
| Spanish | 4.0 /100 | #225 | Tragic 34.1% |
| Delaware | 3.3 /100 | #226 | Tragic 34.2% |
| Immigrants | Panama | 3.3 /100 | #227 | Tragic 34.2% |
| Panamanians | 3.3 /100 | #228 | Tragic 34.2% |
| Immigrants | Sierra Leone | 3.1 /100 | #229 | Tragic 34.2% |
| Ghanaians | 3.1 /100 | #230 | Tragic 34.3% |
| Native Hawaiians | 2.9 /100 | #231 | Tragic 34.3% |
| French Canadians | 2.5 /100 | #232 | Tragic 34.4% |
| Bangladeshis | 2.5 /100 | #233 | Tragic 34.4% |
| Immigrants | Zaire | 2.3 /100 | #234 | Tragic 34.5% |
Demographics Similar to Filipinos by Births to Unmarried Women
In terms of births to unmarried women, the demographic groups most similar to Filipinos are Immigrants from Taiwan (23.0%, a difference of 0.14%), Immigrants from India (22.9%, a difference of 0.38%), Immigrants from Hong Kong (23.6%, a difference of 2.6%), Immigrants from Iran (24.0%, a difference of 4.3%), and Thai (24.0%, a difference of 4.6%).
| Demographics | Rating | Rank | Births to Unmarried Women |
| Assyrians/Chaldeans/Syriacs | 100.0 /100 | #1 | Exceptional 22.0% |
| Immigrants | India | 100.0 /100 | #2 | Exceptional 22.9% |
| Filipinos | 100.0 /100 | #3 | Exceptional 23.0% |
| Immigrants | Taiwan | 100.0 /100 | #4 | Exceptional 23.0% |
| Immigrants | Hong Kong | 100.0 /100 | #5 | Exceptional 23.6% |
| Immigrants | Iran | 100.0 /100 | #6 | Exceptional 24.0% |
| Thais | 100.0 /100 | #7 | Exceptional 24.0% |
| Immigrants | China | 100.0 /100 | #8 | Exceptional 24.7% |
| Immigrants | South Central Asia | 100.0 /100 | #9 | Exceptional 24.7% |
| Immigrants | Eastern Asia | 100.0 /100 | #10 | Exceptional 25.0% |
| Immigrants | Israel | 100.0 /100 | #11 | Exceptional 25.1% |
| Indians (Asian) | 100.0 /100 | #12 | Exceptional 25.3% |
| Iranians | 100.0 /100 | #13 | Exceptional 25.3% |
| Immigrants | Lebanon | 100.0 /100 | #14 | Exceptional 25.3% |
| Immigrants | Singapore | 100.0 /100 | #15 | Exceptional 25.6% |