Scotch-Irish vs Filipino Householder Income Ages 45 - 64 years
COMPARE
Scotch-Irish
Filipino
Householder Income Ages 45 - 64 years
Householder Income Ages 45 - 64 years Comparison
Scotch-Irish
Filipinos
$97,073
HOUSEHOLDER INCOME AGES 45 - 64 YEARS
16.4/ 100
METRIC RATING
208th/ 347
METRIC RANK
$134,910
HOUSEHOLDER INCOME AGES 45 - 64 YEARS
100.0/ 100
METRIC RATING
2nd/ 347
METRIC RANK
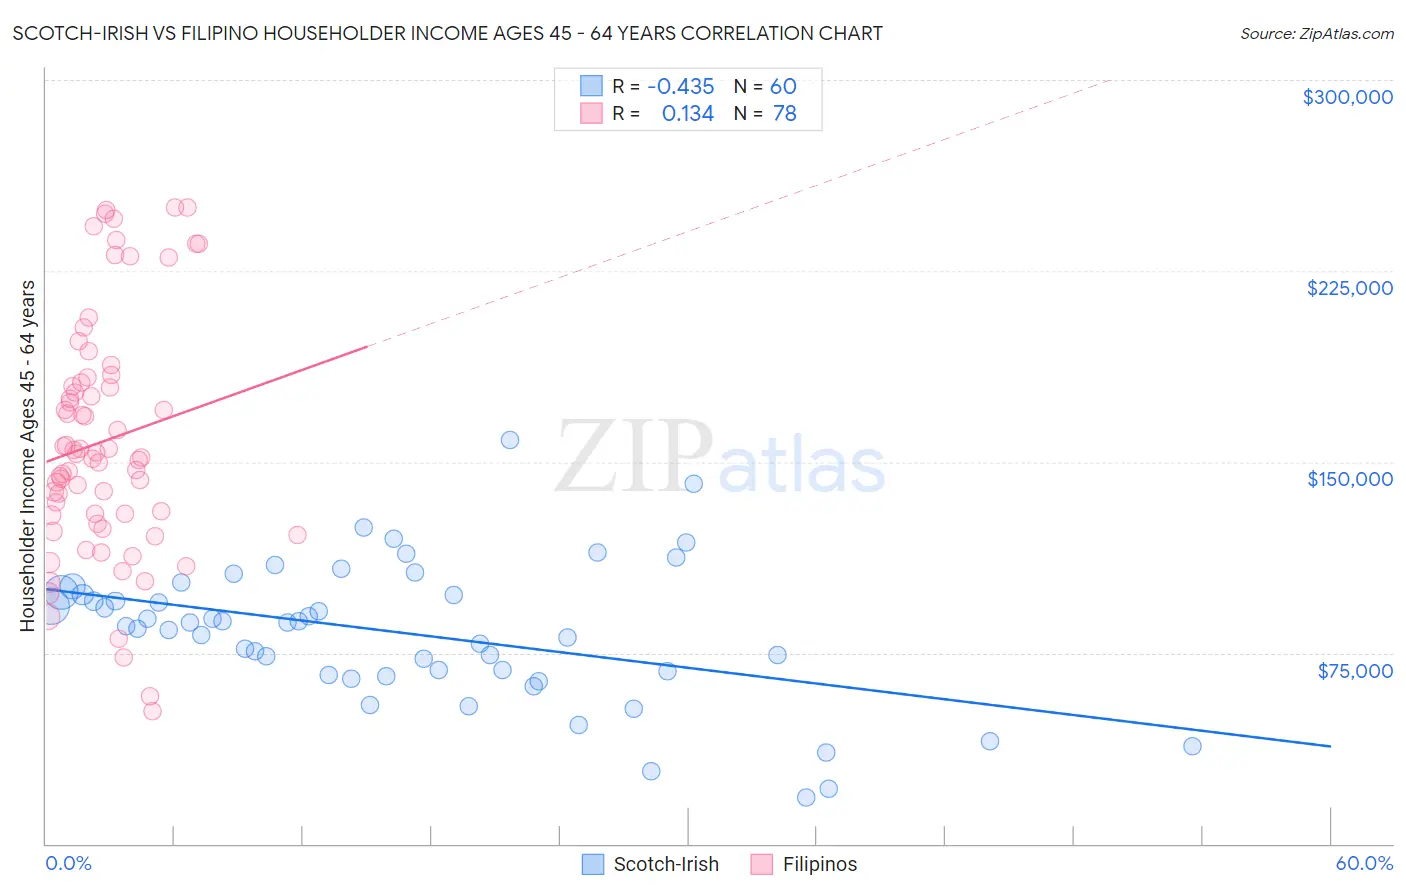
Scotch-Irish vs Filipino Householder Income Ages 45 - 64 years Correlation Chart
The statistical analysis conducted on geographies consisting of 545,781,599 people shows a moderate negative correlation between the proportion of Scotch-Irish and household income with householder between the ages 45 and 64 in the United States with a correlation coefficient (R) of -0.435 and weighted average of $97,073. Similarly, the statistical analysis conducted on geographies consisting of 254,006,751 people shows a poor positive correlation between the proportion of Filipinos and household income with householder between the ages 45 and 64 in the United States with a correlation coefficient (R) of 0.134 and weighted average of $134,910, a difference of 39.0%.
Householder Income Ages 45 - 64 years Correlation Summary
| Measurement | Scotch-Irish | Filipino |
| Minimum | $18,333 | $51,856 |
| Maximum | $158,793 | $250,001 |
| Range | $140,460 | $198,145 |
| Mean | $82,834 | $158,185 |
| Median | $86,155 | $152,545 |
| Interquartile 25% (IQ1) | $67,136 | $128,904 |
| Interquartile 75% (IQ3) | $98,260 | $181,123 |
| Interquartile Range (IQR) | $31,124 | $52,219 |
| Standard Deviation (Sample) | $27,504 | $46,977 |
| Standard Deviation (Population) | $27,274 | $46,675 |
Similar Demographics by Householder Income Ages 45 - 64 years
Demographics Similar to Scotch-Irish by Householder Income Ages 45 - 64 years
In terms of householder income ages 45 - 64 years, the demographic groups most similar to Scotch-Irish are Ghanaian ($97,277, a difference of 0.21%), Immigrants from Colombia ($97,290, a difference of 0.22%), Immigrants from Africa ($97,284, a difference of 0.22%), Japanese ($96,834, a difference of 0.25%), and Tsimshian ($96,783, a difference of 0.30%).
| Demographics | Rating | Rank | Householder Income Ages 45 - 64 years |
| Yugoslavians | 20.0 /100 | #201 | Fair $97,558 |
| Tlingit-Haida | 18.9 /100 | #202 | Poor $97,417 |
| Immigrants | Thailand | 18.8 /100 | #203 | Poor $97,400 |
| Immigrants | Eritrea | 18.6 /100 | #204 | Poor $97,373 |
| Immigrants | Colombia | 18.0 /100 | #205 | Poor $97,290 |
| Immigrants | Africa | 17.9 /100 | #206 | Poor $97,284 |
| Ghanaians | 17.9 /100 | #207 | Poor $97,277 |
| Scotch-Irish | 16.4 /100 | #208 | Poor $97,073 |
| Japanese | 14.8 /100 | #209 | Poor $96,834 |
| Tsimshian | 14.5 /100 | #210 | Poor $96,783 |
| Immigrants | Cambodia | 13.0 /100 | #211 | Poor $96,537 |
| Venezuelans | 12.6 /100 | #212 | Poor $96,460 |
| Immigrants | Uruguay | 10.7 /100 | #213 | Poor $96,086 |
| Panamanians | 10.6 /100 | #214 | Poor $96,066 |
| Nigerians | 8.2 /100 | #215 | Tragic $95,492 |
Demographics Similar to Filipinos by Householder Income Ages 45 - 64 years
In terms of householder income ages 45 - 64 years, the demographic groups most similar to Filipinos are Immigrants from Taiwan ($135,508, a difference of 0.44%), Immigrants from India ($132,488, a difference of 1.8%), Thai ($129,560, a difference of 4.1%), Immigrants from Singapore ($129,514, a difference of 4.2%), and Iranian ($129,350, a difference of 4.3%).
| Demographics | Rating | Rank | Householder Income Ages 45 - 64 years |
| Immigrants | Taiwan | 100.0 /100 | #1 | Exceptional $135,508 |
| Filipinos | 100.0 /100 | #2 | Exceptional $134,910 |
| Immigrants | India | 100.0 /100 | #3 | Exceptional $132,488 |
| Thais | 100.0 /100 | #4 | Exceptional $129,560 |
| Immigrants | Singapore | 100.0 /100 | #5 | Exceptional $129,514 |
| Iranians | 100.0 /100 | #6 | Exceptional $129,350 |
| Immigrants | Hong Kong | 100.0 /100 | #7 | Exceptional $127,500 |
| Immigrants | Iran | 100.0 /100 | #8 | Exceptional $126,940 |
| Okinawans | 100.0 /100 | #9 | Exceptional $124,796 |
| Immigrants | South Central Asia | 100.0 /100 | #10 | Exceptional $124,188 |
| Cypriots | 100.0 /100 | #11 | Exceptional $123,396 |
| Immigrants | Israel | 100.0 /100 | #12 | Exceptional $122,893 |
| Immigrants | Ireland | 100.0 /100 | #13 | Exceptional $122,757 |
| Indians (Asian) | 100.0 /100 | #14 | Exceptional $122,343 |
| Immigrants | Eastern Asia | 100.0 /100 | #15 | Exceptional $122,222 |