Scotch-Irish vs Filipino Median Household Income
COMPARE
Scotch-Irish
Filipino
Median Household Income
Median Household Income Comparison
Scotch-Irish
Filipinos
$80,972
MEDIAN HOUSEHOLD INCOME
6.6/ 100
METRIC RATING
225th/ 347
METRIC RANK
$115,509
MEDIAN HOUSEHOLD INCOME
100.0/ 100
METRIC RATING
2nd/ 347
METRIC RANK
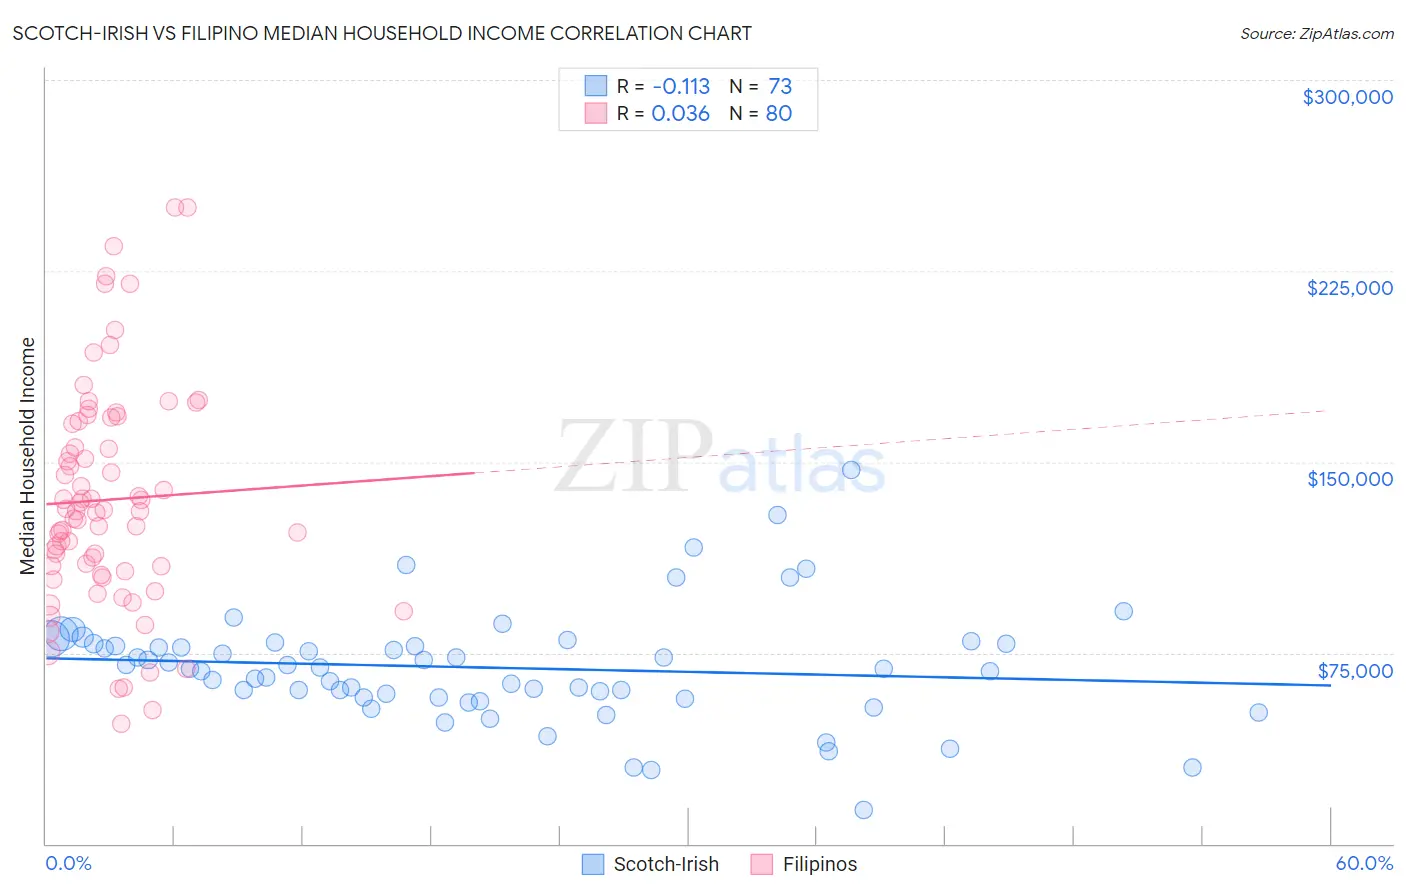
Scotch-Irish vs Filipino Median Household Income Correlation Chart
The statistical analysis conducted on geographies consisting of 548,026,119 people shows a poor negative correlation between the proportion of Scotch-Irish and median household income in the United States with a correlation coefficient (R) of -0.113 and weighted average of $80,972. Similarly, the statistical analysis conducted on geographies consisting of 254,115,678 people shows no correlation between the proportion of Filipinos and median household income in the United States with a correlation coefficient (R) of 0.036 and weighted average of $115,509, a difference of 42.6%.
Median Household Income Correlation Summary
| Measurement | Scotch-Irish | Filipino |
| Minimum | $13,333 | $47,188 |
| Maximum | $146,875 | $250,001 |
| Range | $133,542 | $202,813 |
| Mean | $69,187 | $135,113 |
| Median | $68,778 | $130,633 |
| Interquartile 25% (IQ1) | $57,401 | $107,886 |
| Interquartile 75% (IQ3) | $78,673 | $165,301 |
| Interquartile Range (IQR) | $21,272 | $57,415 |
| Standard Deviation (Sample) | $22,180 | $43,772 |
| Standard Deviation (Population) | $22,027 | $43,498 |
Similar Demographics by Median Household Income
Demographics Similar to Scotch-Irish by Median Household Income
In terms of median household income, the demographic groups most similar to Scotch-Irish are Malaysian ($81,064, a difference of 0.11%), Immigrants from Panama ($80,873, a difference of 0.12%), Guyanese ($80,734, a difference of 0.29%), Immigrants from El Salvador ($81,213, a difference of 0.30%), and Immigrants from Bangladesh ($80,722, a difference of 0.31%).
| Demographics | Rating | Rank | Median Household Income |
| Whites/Caucasians | 12.2 /100 | #218 | Poor $82,029 |
| Nigerians | 10.3 /100 | #219 | Poor $81,725 |
| Immigrants | Venezuela | 9.0 /100 | #220 | Tragic $81,506 |
| Immigrants | Ghana | 9.0 /100 | #221 | Tragic $81,489 |
| Immigrants | Nigeria | 7.7 /100 | #222 | Tragic $81,236 |
| Immigrants | El Salvador | 7.6 /100 | #223 | Tragic $81,213 |
| Malaysians | 7.0 /100 | #224 | Tragic $81,064 |
| Scotch-Irish | 6.6 /100 | #225 | Tragic $80,972 |
| Immigrants | Panama | 6.2 /100 | #226 | Tragic $80,873 |
| Guyanese | 5.7 /100 | #227 | Tragic $80,734 |
| Immigrants | Bangladesh | 5.7 /100 | #228 | Tragic $80,722 |
| Delaware | 5.0 /100 | #229 | Tragic $80,527 |
| Bermudans | 4.7 /100 | #230 | Tragic $80,406 |
| Trinidadians and Tobagonians | 4.7 /100 | #231 | Tragic $80,402 |
| Immigrants | Trinidad and Tobago | 4.6 /100 | #232 | Tragic $80,373 |
Demographics Similar to Filipinos by Median Household Income
In terms of median household income, the demographic groups most similar to Filipinos are Immigrants from Taiwan ($116,460, a difference of 0.82%), Immigrants from India ($113,009, a difference of 2.2%), Immigrants from Hong Kong ($111,519, a difference of 3.6%), Thai ($110,648, a difference of 4.4%), and Immigrants from Singapore ($110,428, a difference of 4.6%).
| Demographics | Rating | Rank | Median Household Income |
| Immigrants | Taiwan | 100.0 /100 | #1 | Exceptional $116,460 |
| Filipinos | 100.0 /100 | #2 | Exceptional $115,509 |
| Immigrants | India | 100.0 /100 | #3 | Exceptional $113,009 |
| Immigrants | Hong Kong | 100.0 /100 | #4 | Exceptional $111,519 |
| Thais | 100.0 /100 | #5 | Exceptional $110,648 |
| Immigrants | Singapore | 100.0 /100 | #6 | Exceptional $110,428 |
| Iranians | 100.0 /100 | #7 | Exceptional $109,835 |
| Immigrants | Iran | 100.0 /100 | #8 | Exceptional $108,055 |
| Okinawans | 100.0 /100 | #9 | Exceptional $106,624 |
| Immigrants | South Central Asia | 100.0 /100 | #10 | Exceptional $106,057 |
| Immigrants | China | 100.0 /100 | #11 | Exceptional $105,335 |
| Indians (Asian) | 100.0 /100 | #12 | Exceptional $105,262 |
| Immigrants | Eastern Asia | 100.0 /100 | #13 | Exceptional $104,796 |
| Immigrants | Ireland | 100.0 /100 | #14 | Exceptional $104,692 |
| Immigrants | Israel | 100.0 /100 | #15 | Exceptional $104,090 |