Luxembourger vs Chickasaw Married-couple Households
COMPARE
Luxembourger
Chickasaw
Married-couple Households
Married-couple Households Comparison
Luxembourgers
Chickasaw
48.5%
MARRIED-COUPLE HOUSEHOLDS
99.1/ 100
METRIC RATING
62nd/ 347
METRIC RANK
45.9%
MARRIED-COUPLE HOUSEHOLDS
22.7/ 100
METRIC RATING
195th/ 347
METRIC RANK
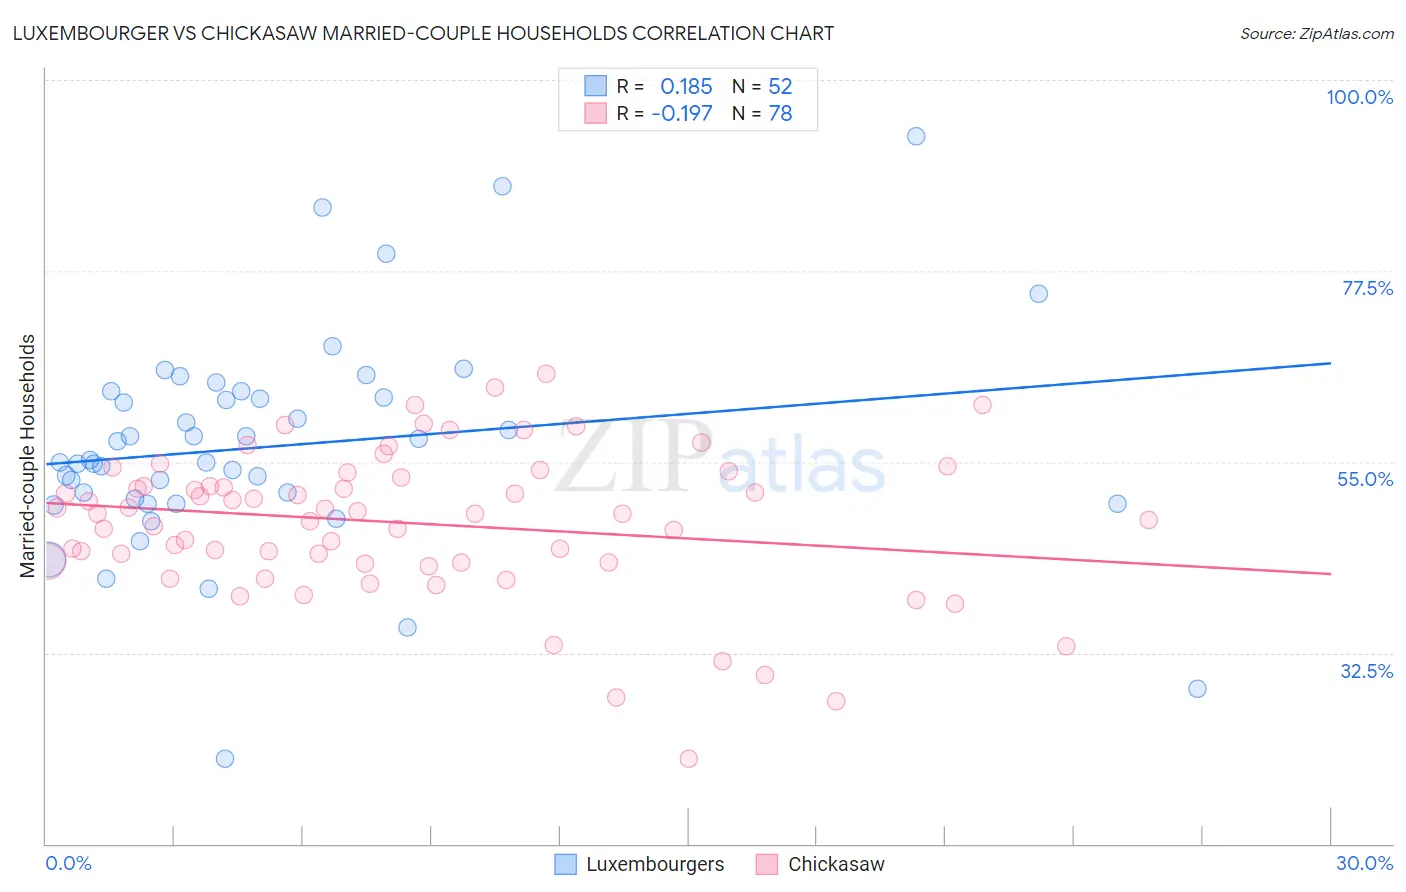
Luxembourger vs Chickasaw Married-couple Households Correlation Chart
The statistical analysis conducted on geographies consisting of 144,648,044 people shows a poor positive correlation between the proportion of Luxembourgers and percentage of married-couple family households in the United States with a correlation coefficient (R) of 0.185 and weighted average of 48.5%. Similarly, the statistical analysis conducted on geographies consisting of 147,672,630 people shows a poor negative correlation between the proportion of Chickasaw and percentage of married-couple family households in the United States with a correlation coefficient (R) of -0.197 and weighted average of 45.9%, a difference of 5.6%.
Married-couple Households Correlation Summary
| Measurement | Luxembourger | Chickasaw |
| Minimum | 20.0% | 20.0% |
| Maximum | 93.3% | 65.4% |
| Range | 73.3% | 45.4% |
| Mean | 56.9% | 47.8% |
| Median | 55.1% | 48.9% |
| Interquartile 25% (IQ1) | 50.3% | 43.2% |
| Interquartile 75% (IQ3) | 62.9% | 53.2% |
| Interquartile Range (IQR) | 12.6% | 10.0% |
| Standard Deviation (Sample) | 13.0% | 8.7% |
| Standard Deviation (Population) | 12.9% | 8.6% |
Similar Demographics by Married-couple Households
Demographics Similar to Luxembourgers by Married-couple Households
In terms of married-couple households, the demographic groups most similar to Luxembourgers are Bulgarian (48.5%, a difference of 0.0%), Croatian (48.5%, a difference of 0.060%), Basque (48.4%, a difference of 0.060%), Northern European (48.4%, a difference of 0.080%), and Immigrants from Canada (48.4%, a difference of 0.090%).
| Demographics | Rating | Rank | Married-couple Households |
| Austrians | 99.3 /100 | #55 | Exceptional 48.6% |
| Immigrants | Northern Europe | 99.3 /100 | #56 | Exceptional 48.6% |
| Poles | 99.2 /100 | #57 | Exceptional 48.5% |
| Immigrants | Indonesia | 99.2 /100 | #58 | Exceptional 48.5% |
| Czechoslovakians | 99.2 /100 | #59 | Exceptional 48.5% |
| Croatians | 99.1 /100 | #60 | Exceptional 48.5% |
| Bulgarians | 99.1 /100 | #61 | Exceptional 48.5% |
| Luxembourgers | 99.1 /100 | #62 | Exceptional 48.5% |
| Basques | 99.0 /100 | #63 | Exceptional 48.4% |
| Northern Europeans | 99.0 /100 | #64 | Exceptional 48.4% |
| Immigrants | Canada | 99.0 /100 | #65 | Exceptional 48.4% |
| Jordanians | 98.9 /100 | #66 | Exceptional 48.4% |
| Romanians | 98.9 /100 | #67 | Exceptional 48.4% |
| Immigrants | South Eastern Asia | 98.9 /100 | #68 | Exceptional 48.4% |
| Immigrants | China | 98.9 /100 | #69 | Exceptional 48.4% |
Demographics Similar to Chickasaw by Married-couple Households
In terms of married-couple households, the demographic groups most similar to Chickasaw are Mexican American Indian (45.9%, a difference of 0.030%), Immigrants from South America (45.9%, a difference of 0.030%), Taiwanese (45.9%, a difference of 0.040%), Cambodian (45.9%, a difference of 0.080%), and Immigrants from Northern Africa (46.0%, a difference of 0.10%).
| Demographics | Rating | Rank | Married-couple Households |
| South American Indians | 28.4 /100 | #188 | Fair 46.0% |
| Immigrants | Latvia | 26.9 /100 | #189 | Fair 46.0% |
| Immigrants | Kuwait | 25.6 /100 | #190 | Fair 46.0% |
| Choctaw | 24.9 /100 | #191 | Fair 46.0% |
| Immigrants | Northern Africa | 24.6 /100 | #192 | Fair 46.0% |
| Taiwanese | 23.4 /100 | #193 | Fair 45.9% |
| Mexican American Indians | 23.3 /100 | #194 | Fair 45.9% |
| Chickasaw | 22.7 /100 | #195 | Fair 45.9% |
| Immigrants | South America | 22.2 /100 | #196 | Fair 45.9% |
| Cambodians | 21.3 /100 | #197 | Fair 45.9% |
| Ottawa | 19.4 /100 | #198 | Poor 45.8% |
| Carpatho Rusyns | 15.7 /100 | #199 | Poor 45.7% |
| Potawatomi | 15.6 /100 | #200 | Poor 45.7% |
| Immigrants | Serbia | 15.2 /100 | #201 | Poor 45.7% |
| Immigrants | Central America | 14.2 /100 | #202 | Poor 45.7% |