Luxembourger vs Bolivian Married-couple Households
COMPARE
Luxembourger
Bolivian
Married-couple Households
Married-couple Households Comparison
Luxembourgers
Bolivians
48.5%
MARRIED-COUPLE HOUSEHOLDS
99.1/ 100
METRIC RATING
62nd/ 347
METRIC RANK
49.2%
MARRIED-COUPLE HOUSEHOLDS
99.8/ 100
METRIC RATING
30th/ 347
METRIC RANK
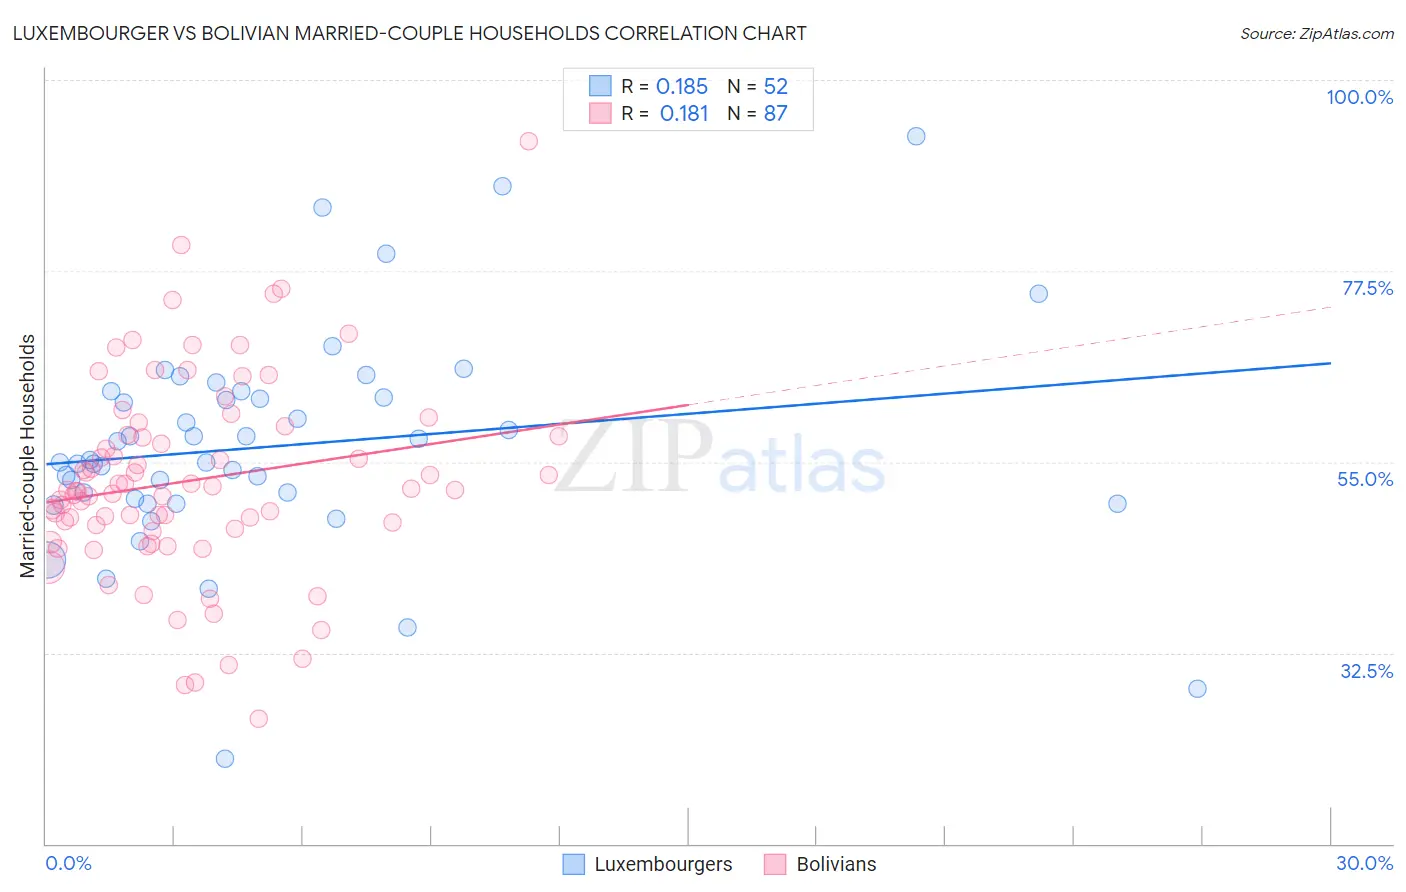
Luxembourger vs Bolivian Married-couple Households Correlation Chart
The statistical analysis conducted on geographies consisting of 144,648,044 people shows a poor positive correlation between the proportion of Luxembourgers and percentage of married-couple family households in the United States with a correlation coefficient (R) of 0.185 and weighted average of 48.5%. Similarly, the statistical analysis conducted on geographies consisting of 184,628,084 people shows a poor positive correlation between the proportion of Bolivians and percentage of married-couple family households in the United States with a correlation coefficient (R) of 0.181 and weighted average of 49.2%, a difference of 1.4%.
Married-couple Households Correlation Summary
| Measurement | Luxembourger | Bolivian |
| Minimum | 20.0% | 24.7% |
| Maximum | 93.3% | 92.8% |
| Range | 73.3% | 68.0% |
| Mean | 56.9% | 52.8% |
| Median | 55.1% | 51.7% |
| Interquartile 25% (IQ1) | 50.3% | 47.0% |
| Interquartile 75% (IQ3) | 62.9% | 58.2% |
| Interquartile Range (IQR) | 12.6% | 11.1% |
| Standard Deviation (Sample) | 13.0% | 11.7% |
| Standard Deviation (Population) | 12.9% | 11.6% |
Similar Demographics by Married-couple Households
Demographics Similar to Luxembourgers by Married-couple Households
In terms of married-couple households, the demographic groups most similar to Luxembourgers are Bulgarian (48.5%, a difference of 0.0%), Croatian (48.5%, a difference of 0.060%), Basque (48.4%, a difference of 0.060%), Northern European (48.4%, a difference of 0.080%), and Immigrants from Canada (48.4%, a difference of 0.090%).
| Demographics | Rating | Rank | Married-couple Households |
| Austrians | 99.3 /100 | #55 | Exceptional 48.6% |
| Immigrants | Northern Europe | 99.3 /100 | #56 | Exceptional 48.6% |
| Poles | 99.2 /100 | #57 | Exceptional 48.5% |
| Immigrants | Indonesia | 99.2 /100 | #58 | Exceptional 48.5% |
| Czechoslovakians | 99.2 /100 | #59 | Exceptional 48.5% |
| Croatians | 99.1 /100 | #60 | Exceptional 48.5% |
| Bulgarians | 99.1 /100 | #61 | Exceptional 48.5% |
| Luxembourgers | 99.1 /100 | #62 | Exceptional 48.5% |
| Basques | 99.0 /100 | #63 | Exceptional 48.4% |
| Northern Europeans | 99.0 /100 | #64 | Exceptional 48.4% |
| Immigrants | Canada | 99.0 /100 | #65 | Exceptional 48.4% |
| Jordanians | 98.9 /100 | #66 | Exceptional 48.4% |
| Romanians | 98.9 /100 | #67 | Exceptional 48.4% |
| Immigrants | South Eastern Asia | 98.9 /100 | #68 | Exceptional 48.4% |
| Immigrants | China | 98.9 /100 | #69 | Exceptional 48.4% |
Demographics Similar to Bolivians by Married-couple Households
In terms of married-couple households, the demographic groups most similar to Bolivians are German (49.2%, a difference of 0.020%), Maltese (49.2%, a difference of 0.020%), Native Hawaiian (49.1%, a difference of 0.11%), Hungarian (49.1%, a difference of 0.17%), and Immigrants from Asia (49.1%, a difference of 0.20%).
| Demographics | Rating | Rank | Married-couple Households |
| Dutch | 99.9 /100 | #23 | Exceptional 49.5% |
| Czechs | 99.9 /100 | #24 | Exceptional 49.4% |
| Immigrants | Philippines | 99.9 /100 | #25 | Exceptional 49.3% |
| Immigrants | Scotland | 99.8 /100 | #26 | Exceptional 49.3% |
| Bhutanese | 99.8 /100 | #27 | Exceptional 49.3% |
| Germans | 99.8 /100 | #28 | Exceptional 49.2% |
| Maltese | 99.8 /100 | #29 | Exceptional 49.2% |
| Bolivians | 99.8 /100 | #30 | Exceptional 49.2% |
| Native Hawaiians | 99.8 /100 | #31 | Exceptional 49.1% |
| Hungarians | 99.8 /100 | #32 | Exceptional 49.1% |
| Immigrants | Asia | 99.7 /100 | #33 | Exceptional 49.1% |
| Italians | 99.7 /100 | #34 | Exceptional 49.0% |
| Scottish | 99.7 /100 | #35 | Exceptional 49.0% |
| Iranians | 99.7 /100 | #36 | Exceptional 49.0% |
| Sri Lankans | 99.7 /100 | #37 | Exceptional 49.0% |