Luxembourger vs Chickasaw In Labor Force | Age 35-44
COMPARE
Luxembourger
Chickasaw
In Labor Force | Age 35-44
In Labor Force | Age 35-44 Comparison
Luxembourgers
Chickasaw
86.4%
IN LABOR FORCE | AGE 35-44
100.0/ 100
METRIC RATING
2nd/ 347
METRIC RANK
80.9%
IN LABOR FORCE | AGE 35-44
0.0/ 100
METRIC RATING
320th/ 347
METRIC RANK
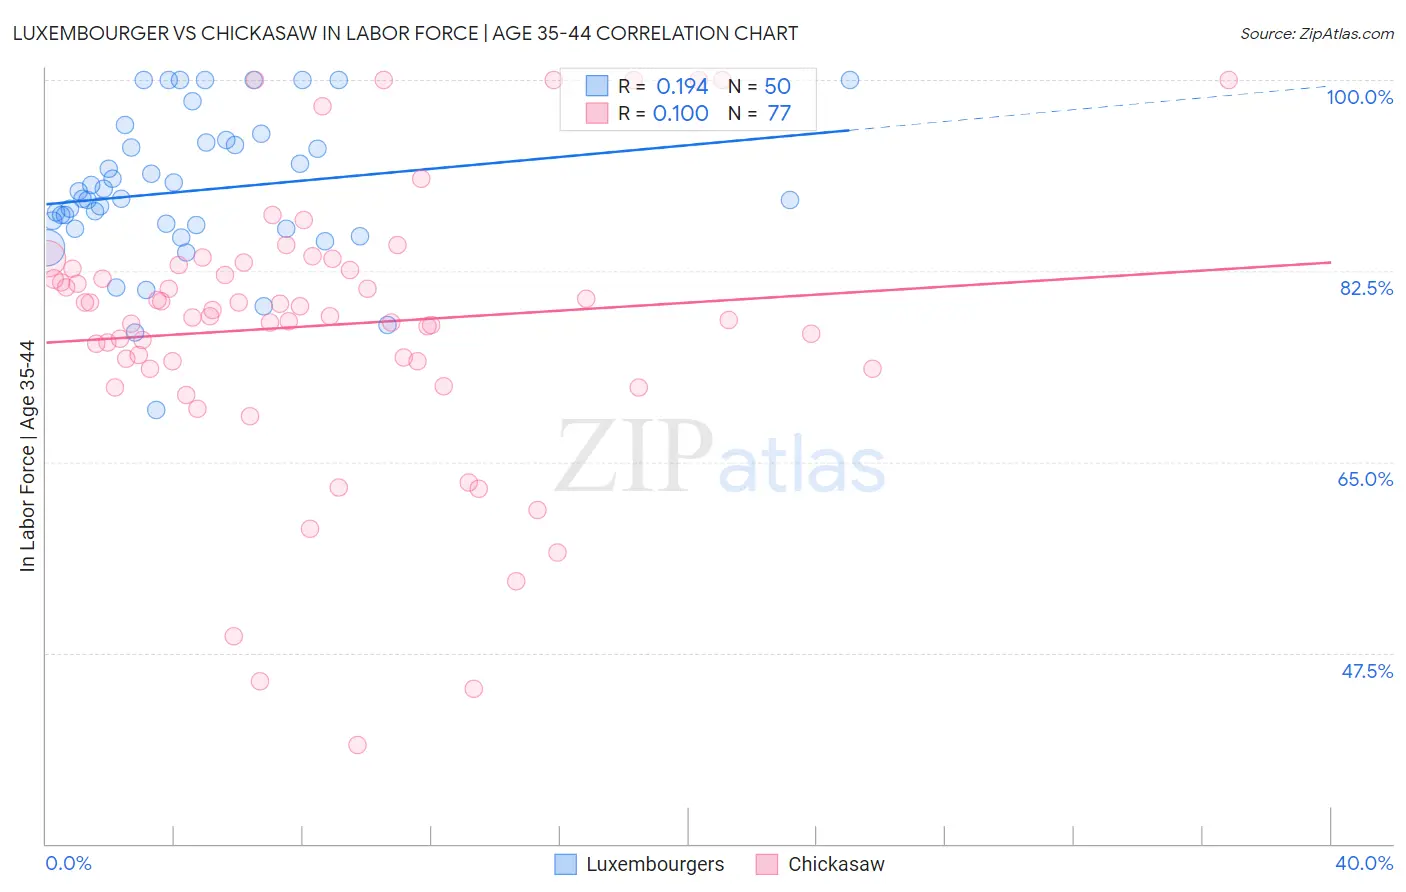
Luxembourger vs Chickasaw In Labor Force | Age 35-44 Correlation Chart
The statistical analysis conducted on geographies consisting of 144,662,796 people shows a poor positive correlation between the proportion of Luxembourgers and labor force participation rate among population between the ages 35 and 44 in the United States with a correlation coefficient (R) of 0.194 and weighted average of 86.4%. Similarly, the statistical analysis conducted on geographies consisting of 147,707,163 people shows a slight positive correlation between the proportion of Chickasaw and labor force participation rate among population between the ages 35 and 44 in the United States with a correlation coefficient (R) of 0.100 and weighted average of 80.9%, a difference of 6.8%.
In Labor Force | Age 35-44 Correlation Summary
| Measurement | Luxembourger | Chickasaw |
| Minimum | 69.7% | 39.0% |
| Maximum | 100.0% | 100.0% |
| Range | 30.3% | 61.0% |
| Mean | 89.9% | 77.5% |
| Median | 89.1% | 78.4% |
| Interquartile 25% (IQ1) | 86.4% | 73.9% |
| Interquartile 75% (IQ3) | 94.3% | 82.9% |
| Interquartile Range (IQR) | 7.9% | 9.0% |
| Standard Deviation (Sample) | 6.8% | 12.5% |
| Standard Deviation (Population) | 6.7% | 12.5% |
Similar Demographics by In Labor Force | Age 35-44
Demographics Similar to Luxembourgers by In Labor Force | Age 35-44
In terms of in labor force | age 35-44, the demographic groups most similar to Luxembourgers are Sierra Leonean (86.4%, a difference of 0.030%), Immigrants from Bolivia (86.2%, a difference of 0.19%), Immigrants from Cabo Verde (86.2%, a difference of 0.22%), Zimbabwean (86.1%, a difference of 0.35%), and Bolivian (86.1%, a difference of 0.36%).
| Demographics | Rating | Rank | In Labor Force | Age 35-44 |
| Sierra Leoneans | 100.0 /100 | #1 | Exceptional 86.4% |
| Luxembourgers | 100.0 /100 | #2 | Exceptional 86.4% |
| Immigrants | Bolivia | 100.0 /100 | #3 | Exceptional 86.2% |
| Immigrants | Cabo Verde | 100.0 /100 | #4 | Exceptional 86.2% |
| Zimbabweans | 100.0 /100 | #5 | Exceptional 86.1% |
| Bolivians | 100.0 /100 | #6 | Exceptional 86.1% |
| Immigrants | Sierra Leone | 100.0 /100 | #7 | Exceptional 86.1% |
| Immigrants | Ethiopia | 100.0 /100 | #8 | Exceptional 85.9% |
| Ethiopians | 100.0 /100 | #9 | Exceptional 85.9% |
| Cape Verdeans | 100.0 /100 | #10 | Exceptional 85.8% |
| Immigrants | Cameroon | 100.0 /100 | #11 | Exceptional 85.8% |
| Liberians | 100.0 /100 | #12 | Exceptional 85.7% |
| Somalis | 100.0 /100 | #13 | Exceptional 85.6% |
| Immigrants | Somalia | 100.0 /100 | #14 | Exceptional 85.6% |
| Norwegians | 100.0 /100 | #15 | Exceptional 85.6% |
Demographics Similar to Chickasaw by In Labor Force | Age 35-44
In terms of in labor force | age 35-44, the demographic groups most similar to Chickasaw are Inupiat (80.9%, a difference of 0.050%), Puerto Rican (80.7%, a difference of 0.28%), Paiute (80.6%, a difference of 0.35%), Yaqui (80.5%, a difference of 0.46%), and Choctaw (80.5%, a difference of 0.47%).
| Demographics | Rating | Rank | In Labor Force | Age 35-44 |
| Mexicans | 0.0 /100 | #313 | Tragic 81.6% |
| Cajuns | 0.0 /100 | #314 | Tragic 81.5% |
| Immigrants | Mexico | 0.0 /100 | #315 | Tragic 81.5% |
| Comanche | 0.0 /100 | #316 | Tragic 81.5% |
| Cherokee | 0.0 /100 | #317 | Tragic 81.4% |
| Alaskan Athabascans | 0.0 /100 | #318 | Tragic 81.3% |
| Inupiat | 0.0 /100 | #319 | Tragic 80.9% |
| Chickasaw | 0.0 /100 | #320 | Tragic 80.9% |
| Puerto Ricans | 0.0 /100 | #321 | Tragic 80.7% |
| Paiute | 0.0 /100 | #322 | Tragic 80.6% |
| Yaqui | 0.0 /100 | #323 | Tragic 80.5% |
| Choctaw | 0.0 /100 | #324 | Tragic 80.5% |
| Dutch West Indians | 0.0 /100 | #325 | Tragic 80.4% |
| Seminole | 0.0 /100 | #326 | Tragic 80.4% |
| Sioux | 0.0 /100 | #327 | Tragic 80.2% |